
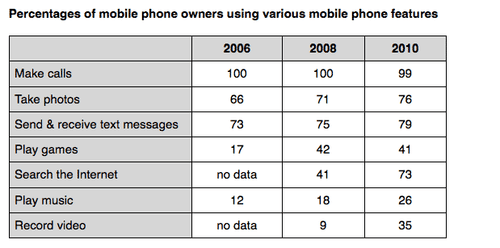
The table illustrates information about mobile owners using various features in 4 different categories: making calls, taking
photos
, sending and receiving messages and recording audio in Vietnam in 2005, 2008 and 2010. Use synonyms
Overall
, Linking Words
it is clear that
the highest amount was making calls, Linking Words
while
the lowest was taking Linking Words
photos
every year.
Use synonyms
Firstly
, in 2005 calls and text messages were 100 and 82 per cent which are the two biggest numbers in total. Linking Words
Accordingly
, recording audio was 78% which descended under 75% in 2008. Linking Words
Furthermore
, taking Linking Words
photos
was 65 per cent in 2005 and increased to 70% and 77% in 2008 and 2010.
Use synonyms
Conversely
, in 2008 the number of phone calls was 100 which dropped to under 97% in 2010.
Linking Words
In addition
, text messages fluctuated between 82%, 73% and 68% in the years. In 2010 the lowest data was record audio with 63%, following send and receive writing. Linking Words
Nevertheless
, the biggest quantity of features was calls with 97%. To compare with, taking Linking Words
photos
was similar in every year.Use synonyms