
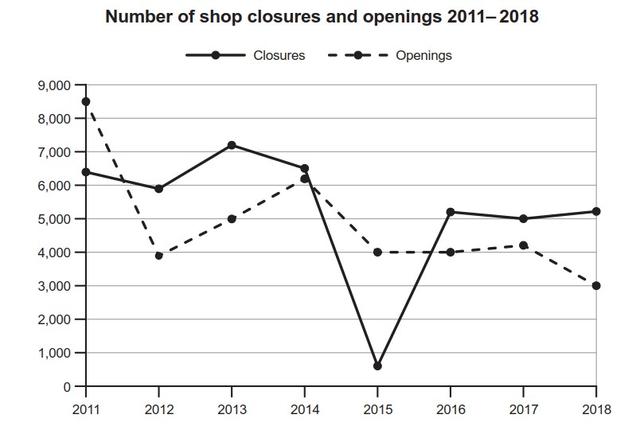
The line graph illustrates the total amounts of yearly shop openings and closures over the span of 7 years from 2011 to 2018.
In general, both shops that were opened and closed saw a non-identical trend throughout the period. It is
also
worth noting that these indicators experienced a gradual decrease.
Focusing on the quantities of new markets, it reduced about to 4000 from 8500 in the years 2011 and 2012. Admittedly, the novel stores witnessed a considerable rise up to 2014 in which it topped out at 6200. In the following year, the data point for the new store showed an identical degree to its initial point in 2012. in the next 3 years, the measurement remained unchanged at nearly 4000 before decreasing by 1000 department stores in the final year.
Regarding the totals of shop terminations, Linking Words
initially
, the counts totalled around 6400 which is much less than openings. Linking Words
However
, launches were overtaken by stoppage in 2012 and reached a peak of 7000 in the following year. There was a sharp decline in the statistics of closings by 6000 from 2014 to 2015. Linking Words
Conversely
, it gained leadership again, reaching just above 5000 in 2016. Linking Words
By contrast
, sums of newly opened shops levelled off approximately at 4000, meanwhile, the figure for closed chains was more or less 1000 stores higher until 2018.Linking Words