
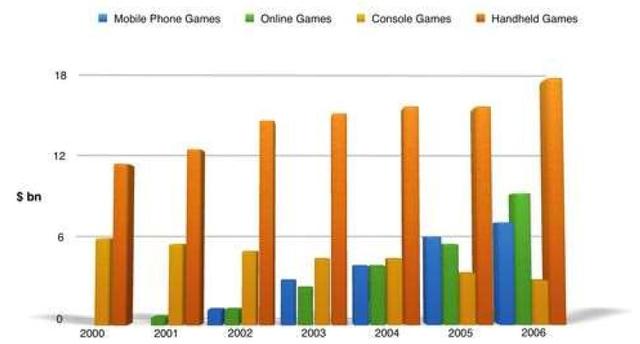
The chart illustrates the revenue of different kinds of digital
games
, including playing on mobile phones, online, consoles, and handheld from 2000 to 2006.
Use synonyms
Overall
, Linking Words
it is clear that
the handheld Linking Words
games
were a gradually increasing trend, Use synonyms
whereas
the console Linking Words
games
decreased slightly in the period.
Use synonyms
To begin
with, in 2000, there was no advertisement on the phone or online. Linking Words
However
, they launched in 2001 and 2002, and the sales were only 2 Linking Words
billion
Use synonyms
dollars
. During the next four years, the Use synonyms
games
which were played on cellphones and the internet were provided 7 and 10 Use synonyms
billion
Use synonyms
dollars
respectively.
Use synonyms
In addition
, the handheld Linking Words
games
reached a peak in 2006, which was around 18 Use synonyms
billion
Use synonyms
dollars
, and it was the highest number Use synonyms
than
other Change preposition
of
games
. Use synonyms
Moreover
, at the beginning, the income of a gaming console was 6 Linking Words
billion
Use synonyms
dollars
, but it became unpopular for people. In 2006, it remained 3 Use synonyms
billion
Use synonyms
dollars
which was the lowest among all of the Use synonyms
games
.Use synonyms