
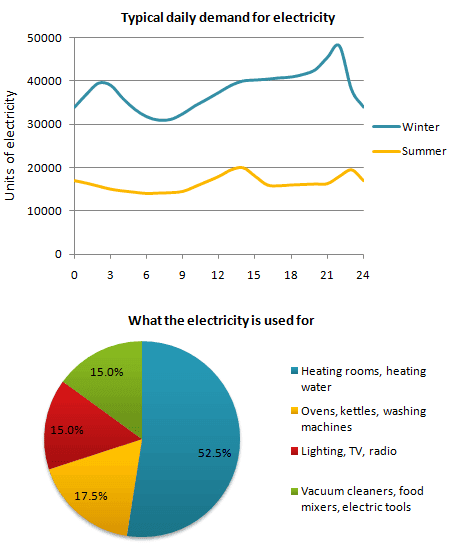
The line graph and the pie chart show data about the amount of
electricity
used.
Use synonyms
Overall
, the daily Linking Words
demand
for Use synonyms
electricity
in winter is higher than in summer. Use synonyms
In addition
, the percentage of Linking Words
electricity
used for heating rooms, and heating water is the highest, meanwhile, the proportion lowest is used for lighting, TV, radio and vacuum cleaners, food mixers, and electric tools.
A deep analysis of the line graph provided reveals in winter the Use synonyms
demand
for Use synonyms
electricity
rose slightly on the 3rd of the month at about 40000, and decreased rapidly between the 6th and 9th of the month at about 30000; Use synonyms
however
, the Linking Words
demand
for Use synonyms
electricity
reached a peak at around 47000 on about 22nd. Meanwhile, the Use synonyms
demand
for Use synonyms
electricity
in summer is a period of slight volatility, reaching a peak at 20000 on about the 14th and reaching a peak lower at about 20000 on around the 23rd of the month.
It is noticeable that the proportion of Use synonyms
electricity
used for heating rooms, and heating machines is the highest at 52.5%. Use synonyms
In contrast
, the Linking Words
electricity
used for lighting, TV, and radio is the lowest just at 15% and it has the same percentage as the Use synonyms
electricity
used for vacuum cleaners, food mixers, and electric tools.Use synonyms