The Pie chart gives information about the country of birth of people living in Australia and the table shows where people born in these countries live. Summarise the information by selecting and reporting the main features and make comparisons where relevant.

The Pie chart gives information about the country of birth of people living in Australia and the table shows where people born in these countries live.

Summarise the information by selecting and reporting the main features and make comparisons where relevant.
The pie chart and the table explain the proportions of
population
Add an article
the population
show examples
in
Australia
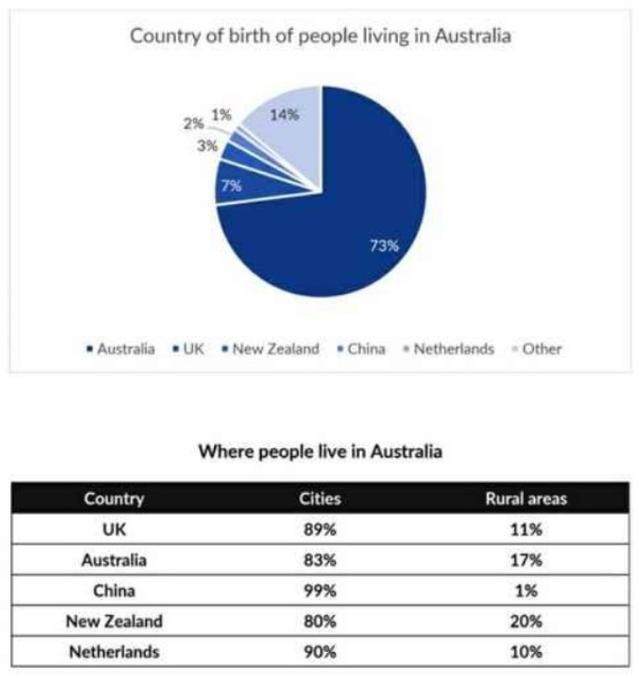
based on the area they currently reside and their country of birth.
To begin
with, the Australian-born are dominating the percentage of people living in
Australia
by 73% as shown on the pie chart, outnumbering the population born outside of
Australia
, which was born in the UK, China, New Zealand, Netherlands and other countries.
On the other hand
, the table indicates the number of people settled in Cities and remote areas. The cities are populated by 99% of the Chinese-born
while
only 1%
living
Replace the word
live
show examples
in rural areas.
Overall
, both
chart
Correct article usage
the chart
show examples
and table show the current demography in
Australia
.
Submitted by firmanrasyidi on

Unauthorized use and/or duplication of this material without express and written permission from this site’s author and/or owner is strictly prohibited. Excerpts and links may be used, provided that full and clear credit is given to Writing9 with appropriate and specific direction to the original content.

Common mistake: Your writing should be 150-250 words.
Vocabulary: Replace the words australia with synonyms.
Vocabulary: The word "chart" was used 3 times.
Vocabulary: The word "table" was used 3 times.
What to do next:
Look at other essays: