
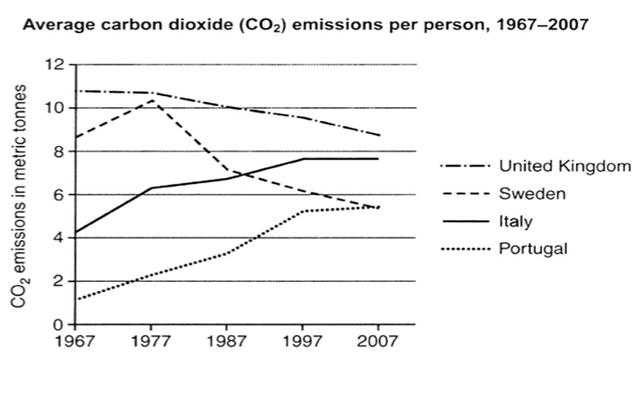
The line chart illustrates how many
tonnes
per Use synonyms
person
released average carbon dioxide Use synonyms
emissions
in four different countries from 1967 to 2007.
Use synonyms
Overall
, Linking Words
while
there were downward trends in the average C02 Linking Words
emissions
per Use synonyms
person
from the UK and Use synonyms
Sweden
, the opposite was true in other countries. Use synonyms
Moreover
, despite the significant reduction of CO2 Linking Words
emissions
in the UK, its average Use synonyms
emissions
recorded the highest in the period of time.
Use synonyms
To begin
with, the upward tendencies could be seen in the number of Linking Words
tonnes
of CO2 Use synonyms
emissions
per Use synonyms
person
coming from Italy and Portugal. In 1967, there were under 2 Use synonyms
tonnes
of CO2 Use synonyms
emissions
per Use synonyms
person
in Portugal, Use synonyms
then
sharply increased to nearly 6 Linking Words
tonnes
in 2007, which reached the same levels of C02 Use synonyms
emissions
per Use synonyms
person
in Use synonyms
Sweden
. The average C02 Use synonyms
emissions
in Italy started at twice times high as CO2 Use synonyms
emissions
in Portugal and surpassed the Use synonyms
emissions
of Use synonyms
Sweden
from 1987, which were over 7 Use synonyms
tonnes
. Use synonyms
At the end
of the period, it ranked second at the level of around 8 Linking Words
tonnes
.
Use synonyms
On the contrary
, Linking Words
although
8 Linking Words
tonnes
of Use synonyms
emissions
per Use synonyms
person
in Use synonyms
Sweden
positioned third in the total of four nations, Use synonyms
this
number only soared once, which was over 10 Linking Words
tonnes
in 1977 and dropped by 4 Use synonyms
tonnes
after 30 years. Looking at the rest, the UK’s average Use synonyms
emissions
per Use synonyms
person
experienced a slight decrease from about 11 Use synonyms
tonnes
to 9 Use synonyms
tonnes
, still being in the first position through 40 years of the period.Use synonyms