
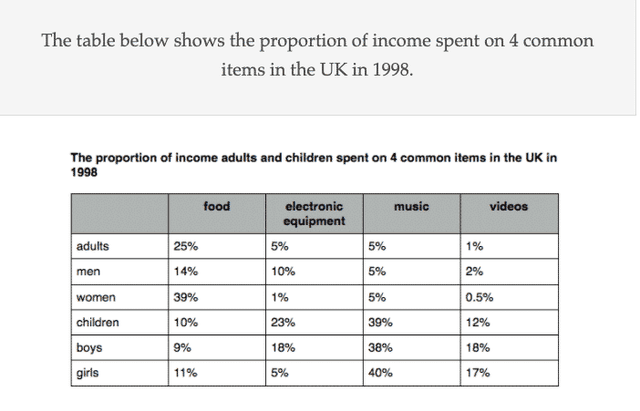
The chart depicts the amount of revenue that the crowd spent on 4 everyday items in the UK in 1998.
To start with, People who like to eat and listen to
music
spend a great percentage of money in his category. Use synonyms
Although
food was shown to be more popular than Linking Words
music
, Use synonyms
consequently
1\4 adults gave their money to their stomach, Linking Words
which
women Correct your spelling
with
had
more addiction than men(39% and 14%). Wrong verb form
having
However
, Children seemed less likely to pay for the food than adults which was approximately 10%. At that time, 5% of dwellers unwind Linking Words
while
listening to the Linking Words
music
.Use synonyms
Nonetheless
, teenagers had Linking Words
a
interest compared to adults(around 40%) .
Change the article
an
By contrast
, The population who were into making videos and taking clips were not over 3%, despite of, youngstres who had a passion to contribute videos were 12%, respectively. Linking Words
Furthermore
, tech equipments were out of fashion, drastically 5% and 23%.
Linking Words
Overall
, as can be vividly seen from the chart, A number of people got pleasured in terms of spending money on Linking Words
music
and food. Use synonyms
Nevertheless
, other Linking Words
staffs
were less likely by persons.Fix the agreement mistake
staff