
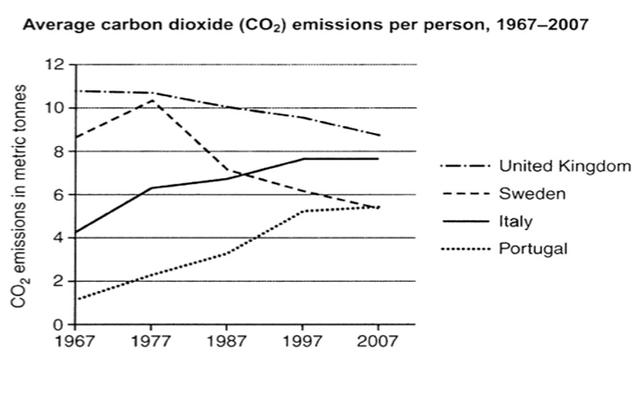
The line graph illustrates on average
carbon
Use synonyms
dioxide
released by every individual in four different countries over the Use synonyms
period
of 40 years.
It is clearly seen that, throughout the Use synonyms
period
the United Kingdom was the highest amongst the other four nations in releasing CO2 and it is Use synonyms
also
notable that there was a drastic decrease in Sweden’s CO2 emission, whilst the other two regions kept growing in leaking CO2 till the Linking Words
year
2007.
Use synonyms
To begin
with, in the Linking Words
year
1967 England outflowed nearly 11 metric Use synonyms
tonnes
of Use synonyms
carbon
Use synonyms
dioxide
into the air, after remaining steady for a decade it started dropping and reached close to 9 metric Use synonyms
tonnes
by the end of the Use synonyms
period
. Use synonyms
On the other hand
, Sweden was at approximately 9 metric Linking Words
tonnes
in the Use synonyms
year
1967 and reached its peak by nearing 11 metric Use synonyms
tonnes
but Use synonyms
then
we can see a drastic dip from the Linking Words
year
1977 till the rest of the Use synonyms
period
, Use synonyms
at the end
Sweden was identically matching with Portugal.
Linking Words
Furthermore
, the two countries which were lower compared to others in 1967 were Portugal just above 1 metric tonne and Italy around 4 metric Linking Words
tonnes
, despite being lowest in the beginning, both the countries kept growing in releasing Use synonyms
carbon
Use synonyms
dioxide
and Use synonyms
at the end
of the era Italy was second highest with nearly 8 metric Linking Words
tonnes
in the amount of leaking CO2 and Portugal was as same as Sweden at just above 5 metric Use synonyms
tonnes
of Use synonyms
carbon
Use synonyms
dioxide
in the air.Use synonyms