
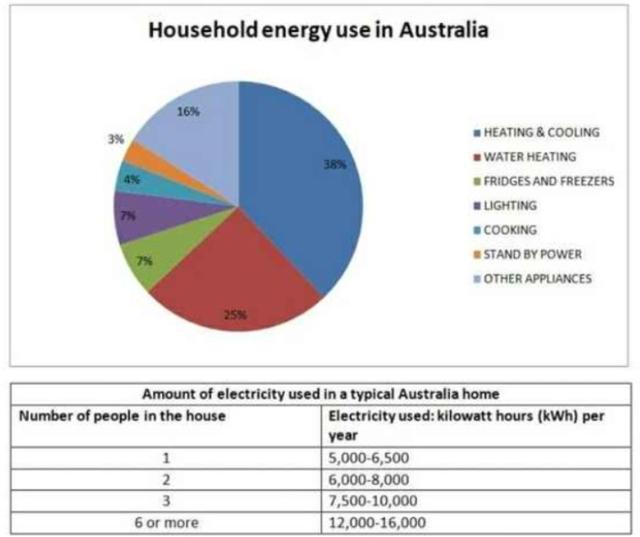
The circle diagram illustrates the power expenditure of an average house in Australia,
while
the table provides data on the total electricity consumption.
Linking Words
Overall
, it is evident that a significant portion of energy is used by systems requiring heating or cooling functions, with the annual KWH increasing with the number of occupants.
Linking Words
According to
the pie chart, general and water heating, Linking Words
along with
cooling installations, dominate expenditures, comprising 63% of the total. Linking Words
Conversely
, the most efficient frameworks are vampire devices (always connected but not in use) and cooking facilities, representing only a small minority at 3% and 4%, respectively. Approximately one-fourth of the total heating and cooling systems belong to appliances like cloth and dishwashers, Linking Words
hair
dryers. Lighting and freezers account for an equally small proportion (seven per cent) of the Correct word choice
and hair
overall
consumption.
Linking Words
Furthermore
, the information in the table suggests that a substantial amount of electricity is consumed in homes with six or more people, ranging from 12,000 to 16,000 KWH annually. Linking Words
However
, houses with a solitary occupant only use between 5,000 and 6,500 KWH.Linking Words