
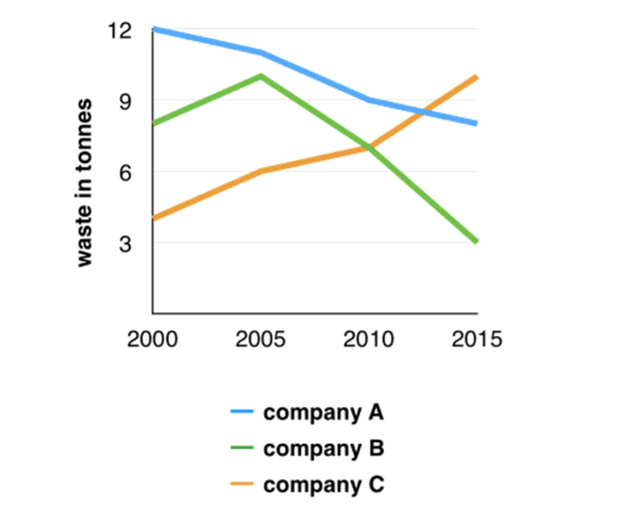
The graph illustrates information about the
waste
Use synonyms
production
of three different Use synonyms
companies
over a 15-year Use synonyms
period
between 2000 and 2015.
What stands out from the chart is that Use synonyms
company
A was responsible for the majority of Use synonyms
waste
produced in the Use synonyms
period
shown. Use synonyms
Overall
, Linking Words
companies
A and Use synonyms
B
witnessed a significant decrease, Use synonyms
while
the Linking Words
figure
relevant to Use synonyms
company
C rose.
In 2000, around 12 Use synonyms
tonnes
of Use synonyms
waste
Use synonyms
production
came from Use synonyms
company
A, which meant that its Use synonyms
amount
was far higher than that of the other Use synonyms
companies
. At Use synonyms
this
point, the wastefulness produced by Linking Words
companies
Use synonyms
B
and C was approximately 8 and 4 Use synonyms
tonnes
, respectively.
Looking at the details, the Use synonyms
waste
Use synonyms
production
of Use synonyms
company
C went up steadily by the Use synonyms
amount
of nearly 6 Use synonyms
tonnes
until 2015, overtaking the Use synonyms
figure
of Use synonyms
company
Use synonyms
B
in 2010. Regarding Use synonyms
company
Use synonyms
B
, the Use synonyms
amount
of Use synonyms
waste
produced by it peaked at almost 10 Use synonyms
tonnes
in 2005 and Use synonyms
then
plummeted, reaching the Linking Words
amount
of 3 Use synonyms
tonnes
in the Use synonyms
last
year of the Linking Words
period
. As for Use synonyms
company
A, the Use synonyms
figure
fell considerably, which Use synonyms
figure
being the lowest Use synonyms
amount
of its Use synonyms
waste
Use synonyms
production
during the whole Use synonyms
period
in question.Use synonyms