The graph below gives information about international tourist arrivals I different parts of the world. Sumarise the information by selectiong and reporting the main features, and make comparisions where relevant.

The graph below gives information about international tourist arrivals I different parts of the world. 

Sumarise the information by selectiong and reporting the main features, and make comparisions where relevant.
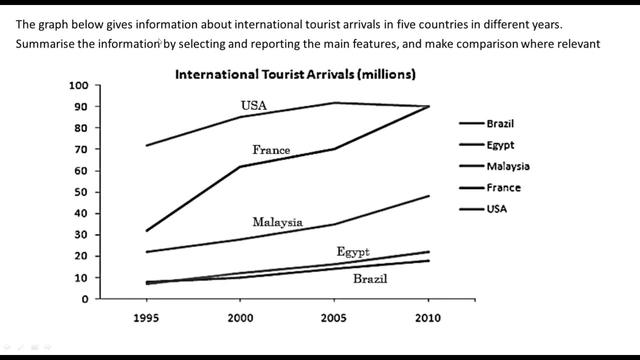
The graph line depicts information about international tourist arrivals in five countries from 1995 until 2010. It is clear from the graph that the
USA
and
France
rinks the highest numbers and they met in 2010 with the same number. The tourists arrived in
Egypt
in 1995 nearly 10
million
as same as Brazil. Between 1995 and 2000
Egypt
increased smoothly.
However
. Brazil recorded lower than
Egypt
in the same period. Malaysia ranks the third highest number of tourist arrivals with more than 20
million
in 1995.
In addition
, the period from 2000 until 2010 was increasing.
France
achieved the second highest with 30
million
in 1995
,
Remove the comma
apply
show examples
and uplifted the dopple in 2000. In 2010
France
met with the
USA
at the same point approximately 90
million
tourists.
Moreover
, the
USA
stood out with more than 90
million
tourist arrivals which is the highest number.
To sum up
, we could say that
although
Malaysia was higher than
Egypt
and Brazil, but still much lower than the
USA
and
France
.
Submitted by Yousef on

Unauthorized use and/or duplication of this material without express and written permission from this site’s author and/or owner is strictly prohibited. Excerpts and links may be used, provided that full and clear credit is given to Writing9 with appropriate and specific direction to the original content.

Sentences: Add more complex sentences.
Basic structure: Use less body paragraphs.
Basic structure: Change the sixth paragraph.
Vocabulary: Replace the words usa, france, egypt, million with synonyms.
Vocabulary: Rephrase the word "information" in your introduction.
Vocabulary: The word "graph" was used 2 times.
Vocabulary: Use several vocabularies to present the data in the sixth paragraph.
Topic Vocabulary:
  • international tourist arrivals
  • insight
  • trend
  • significant
  • fluctuation
  • statistic
  • peak
  • trough
  • steady growth
  • decline
  • surge
  • data point
  • comparative
  • quantitative analysis
  • economic factor
  • political stability
  • tourism sector
  • global event
  • destination popularity
  • benchmark
  • year-on-year change
What to do next:
Look at other essays: