
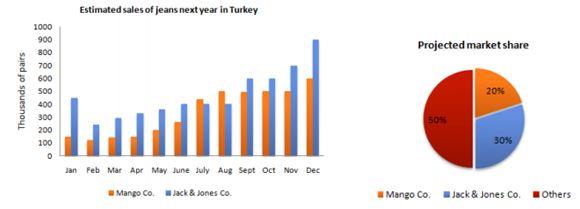
The bar
chart
illustrates the estimated Use synonyms
sales
of Use synonyms
jeans
next Use synonyms
year
and the pie Use synonyms
chart
gives information about the projected Use synonyms
market
Use synonyms
share
Use synonyms
at the end
of next Linking Words
year
for two companies in Use synonyms
jeans
in Turkey.
Use synonyms
Overall
, the Linking Words
sales
of Use synonyms
jeans
by Jack & Use synonyms
Jones
Use synonyms
Co
. were higher than Use synonyms
Mango
Use synonyms
Co
. in the next Use synonyms
year
. Use synonyms
In addition
, the projected Linking Words
market
Use synonyms
share
of Jack & Use synonyms
Jones
Use synonyms
Co
. in Use synonyms
jeans
is Use synonyms
also
higher than Linking Words
Mango
Use synonyms
Co
. Use synonyms
at the end
of next Linking Words
year
.
A deep analysis of the bar Use synonyms
chart
provided reveals in January of the next Use synonyms
year
the Use synonyms
sales
of Use synonyms
jeans
by Jack & Use synonyms
Jones
Use synonyms
Co
. were higher than Use synonyms
Mango
Use synonyms
Co
. (about 450 Use synonyms
thousand
Use synonyms
pairs
and about 150 Use synonyms
thousand
Use synonyms
pairs
respectively). Use synonyms
Besides
, estimated the Linking Words
sales
of Use synonyms
jeans
by Jack & Use synonyms
Jones
Use synonyms
Co
. increase from about 250 Use synonyms
thousand
Use synonyms
pairs
in February to 900 Use synonyms
thousand
Use synonyms
pairs
in December of next Use synonyms
year
. Use synonyms
In contrast
, in only 2 months the Linking Words
sales
of Use synonyms
jeans
by Use synonyms
Mango
Use synonyms
Co
. were higher than Jack & Use synonyms
Jones
Use synonyms
Co
. are July and August.
It is noticeable in the pie Use synonyms
chart
that the projected Use synonyms
market
Use synonyms
share
in Use synonyms
jeans
of both Jack & Use synonyms
Jones
Use synonyms
Co
. and Use synonyms
Mango
Use synonyms
Co
. have a proportion of 50% of the Use synonyms
market
Use synonyms
share
in Use synonyms
jeans
of Turkey. Meanwhile, the Use synonyms
market
Use synonyms
share
in Use synonyms
jeans
of Jack & Use synonyms
Jones
Use synonyms
Co
. is higher than Use synonyms
Mango
Use synonyms
Co
. (about 30% and 20% respectively).Use synonyms