
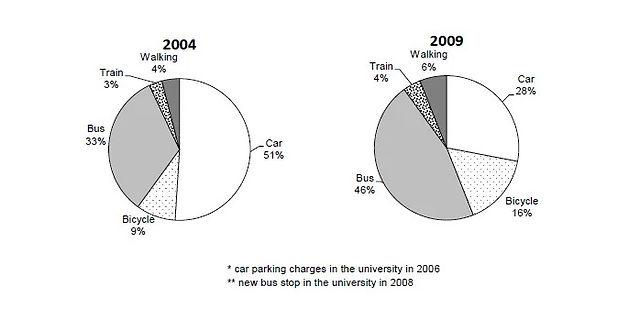
The two pie charts illustrate the principal methods of transportation for people travelling to one university for work or study from 2004 to 2009.
At first glance,
it is clear that
, at the beginning of the period, utilizing trains was the least piece Linking Words
while
using cars was a significant segment and employing bicycles was the average division. In comparison, Linking Words
at the end
of the period, the use of trains remained as bicycles Linking Words
while
employing buses became the largest slice.
Using to go and come by train comprised 3% in the first year and Linking Words
this
showed a slight rise of 1% to 4% in 2009. Linking Words
Likewise
, in 2004 the utilisation of cars at 51% which decreased gradually to 28% 10 years later.
With regard to the remaining methods of using transport, there was an appropriate 7% in utilizing bicycle influence to 16%. Linking Words
On the other hand
, the use of the bus increased from 33% to 46%.Linking Words