
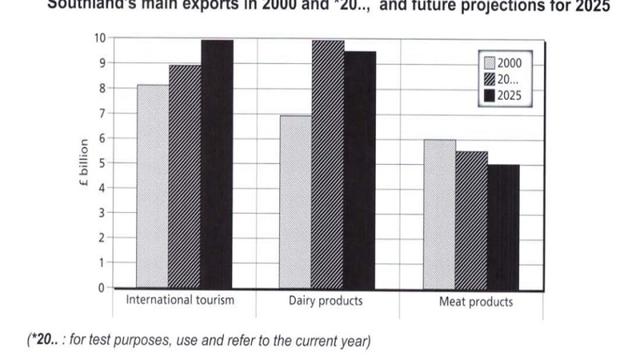
The chart shows
number
of main exports of southland in three types of time 2000, 20.. (current year) and Use synonyms
also
prediction in 2025. It include: international tourism, daily Linking Words
products
and meal Use synonyms
products
.
Use synonyms
According to
the chart, we can see that Linking Words
number
of international tourism has been the most than each others.
Use synonyms
Next,
second highest Linking Words
number
is about daily Use synonyms
products
. And the Use synonyms
last
one scored the lowest Linking Words
number
. To Use synonyms
number
of international tourism, it predicts that 2025 will get the highest score of Use synonyms
number
because it going to nearly 10 Use synonyms
billion
Use synonyms
then
the second high is to 20s with 9 Linking Words
billion
and in 2000 was the lowest just little than 8 Use synonyms
billion
. Use synonyms
Next,
to the daily Linking Words
products
, highest for 20...s with 10 Use synonyms
billion
Use synonyms
products
and no less more for 2025 in future which will be scored 9 Use synonyms
billion
and a half. Daily Use synonyms
products
lowest's score still in 2000 for only 7 Use synonyms
billion
of Use synonyms
products
. And the final main export: meat Use synonyms
products
lowest score of all, which has the best year of Use synonyms
number
is 6 Use synonyms
billion
and a half and the prediction of decreasing in 2025 for only 5 Use synonyms
billion
of meat Use synonyms
products
have consumed.Use synonyms