
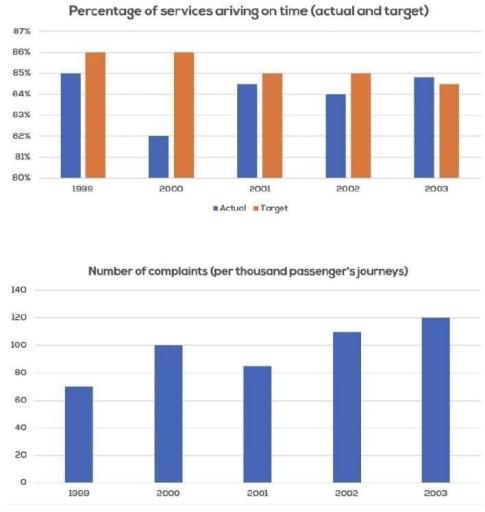
The charts illustrate the proportion of whether the bus is punctual, including actual and budget, and how many complaints are made by commuters.
Overall
, Linking Words
it is clear that
the target of punctuality is a considerable decrease during the period, Linking Words
while
the real situation is a rising trend after 2000.
Linking Words
To begin
with, the critics were the lowest, which was around 70, and the rate of punctuality was the highest at 85% in 1999. One year later, the percentage of buses arriving on time was only 82%, which was less than 4% of the target. Linking Words
Therefore
, the bus company received 100 complaints, which was higher than the number in 1999.
Linking Words
Although
the punctuality rate increased by 2% in 2002, the negative feedback still rose to 110. Linking Words
However
, Linking Words
at the end
of the period, the actual rate was nearly 85% beyond the budget, Linking Words
whereas
the number of critics reached a peak at 120.Linking Words