
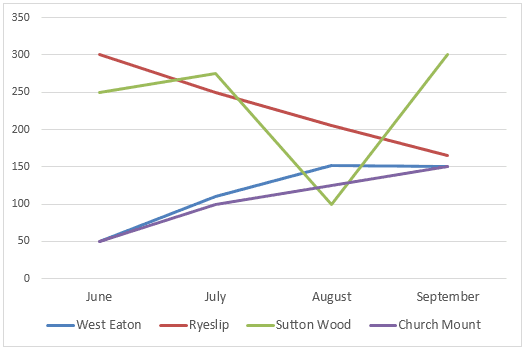
The picture below delineates the number of
books
borrowed from West Eaton, Ryesip, Sutton Wood and Church Mounth Use synonyms
libraries
in the span of 4 months, starting from June to September.
Use synonyms
Overall
, they experienced a variety of trends as can be seen from the graph. Linking Words
This
essay is going to provide readers with Linking Words
further
information on the data.
In the initial month, all four Linking Words
libraries
started at different points. Ryeslip had the highest statistic with as high as 300 bills were borrowed. Use synonyms
However
, in the following months, it experienced a constant decline with around 170 statements total in September. The next highest borrowed Linking Words
books
library was Sutton Wood with 250 Use synonyms
books
. Its trendlines oscillated dramatically with an additional 50 records being lent in September.
Use synonyms
Subsequently
, in the two lower brackets, there are West Eaton and Church Mount Linking Words
libraries
that share the same proportion of Use synonyms
books
with exactly 50 records lent to people. Both of those Use synonyms
libraries
more and less had the same figures with West Eaton's slightly higher. Use synonyms
Nonetheless
, they eventually shared the same number again in the Linking Words
last
month with 150 Linking Words
books
respectively.Use synonyms