
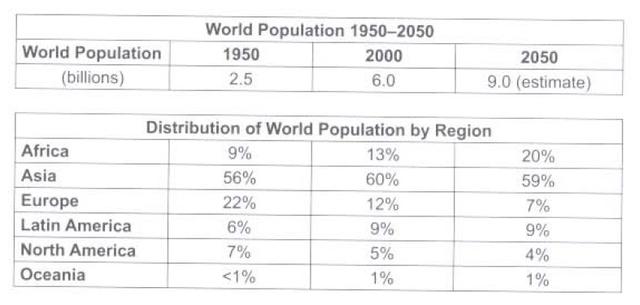
The first
table
illustrates the Use synonyms
world
Use synonyms
population
for 1950–2000 and makes a prediction of how it will be in 2050. The second Use synonyms
table
shows the Use synonyms
distribution
of the Use synonyms
world
Use synonyms
population
in 1950–2000 by region and makes a prediction of how it will be in 2050.
Use synonyms
Firstly
, the first Linking Words
table
estimates that the Use synonyms
world
Use synonyms
population
in 2050 will be 9.0 billion, which means an increase from 2000 by 150%. Having a massive percentage increase in Use synonyms
population
like Use synonyms
this
may have an effect on the Linking Words
distribution
in various regions.
Use synonyms
Secondly
, the later Linking Words
table
shows that Asia had the highest percentage of Use synonyms
population
Use synonyms
distribution
in the Use synonyms
world
Use synonyms
for
1950 and 2000. Change preposition
between
Therefore
, the Linking Words
table
estimates that it will Use synonyms
also
have the highest Linking Words
population
Use synonyms
distribution
in 2050. Use synonyms
On the other hand
, Oceania had the lowest Linking Words
population
Use synonyms
distribution
in 1950 and 2000, so it will Use synonyms
also
be Linking Words
for
2050.Change preposition
in