
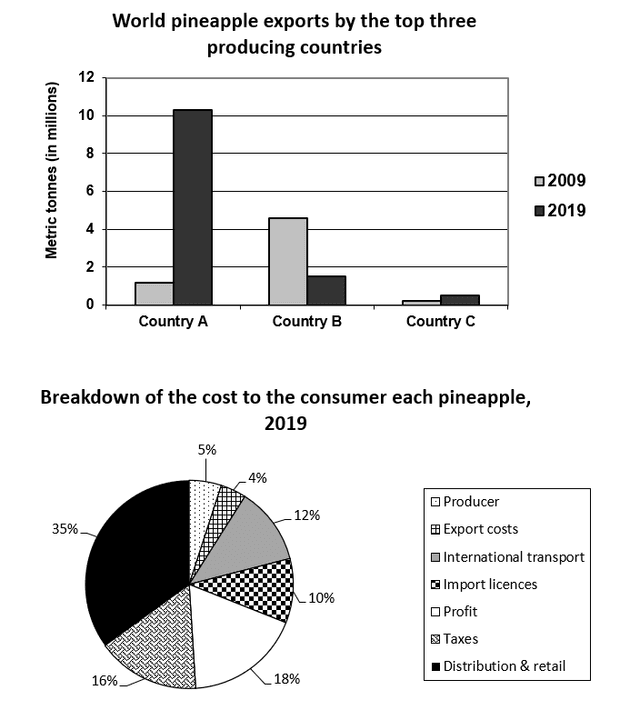
The bar graph illustrates global
pineapple
exports by three major Use synonyms
pineapple
-producing nations between 2009 and 2019, Use synonyms
while
the pie chart elucidates the breakdown of consumer costs for each Linking Words
pineapple
in 2019.
Use synonyms
Overall
, Linking Words
it is clear that
in 2009, Linking Words
country
Use synonyms
B
was the most productive Use synonyms
country
before being exceeded by Use synonyms
country
A in the next decade. Use synonyms
Moreover
, distribution & Linking Words
retail
costs were the major contributors to the price of each Correct word choice
and retail
pineapple
.
In terms of the number of pineapples exported at the beginning, Use synonyms
country
A and Use synonyms
country
Use synonyms
B
started at around a million Use synonyms
tonnes
and 4.5 million Use synonyms
tonnes
, respectively. Use synonyms
However
, in 2019, Linking Words
country
Use synonyms
B
experienced a noticeable decrease by approximately half, Use synonyms
whereas
Linking Words
country
A, which overtook Use synonyms
country
Use synonyms
B
's position, witnessed a skyrocket to around 10 million Use synonyms
tonnes
. Use synonyms
Furthermore
, Linking Words
country
C stood below 0,5 metric Use synonyms
tonnes
and remained relatively stable throughout the period.
Regarding the cost to buyers for each Use synonyms
pineapple
in 2019, distribution & Use synonyms
retail
constituted 35% of the total cost, making it the prime patron to the price, followed by profit and taxes, which accounted for 18% and 16%, respectively. The other costs—international transport, taxes, producer, and export—comprised around a third of the Correct word choice
and retail
overall
costs.Linking Words