
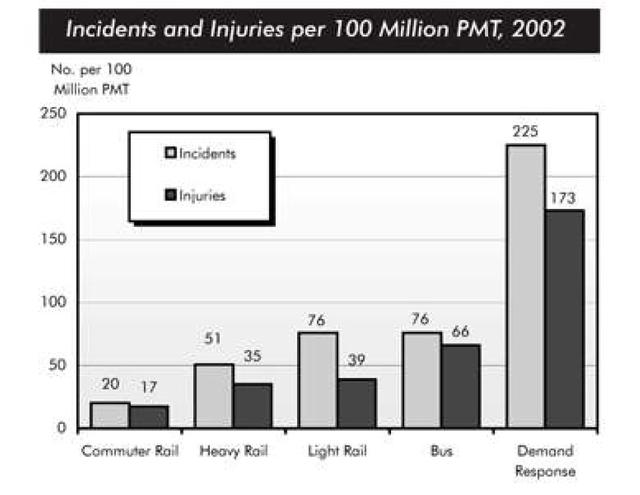
The provided bar charts illustrate data concerning the
incidents
and Use synonyms
injuries
per 100 Use synonyms
million
passenger miles Use synonyms
traveled
(Change the spelling
travelled
PMT
) for four different modes of transportation, Use synonyms
along with
demand response. Notably, demand response stands out as the primary contributor to both Linking Words
incidents
and Use synonyms
injuries
, Use synonyms
while
commuter Linking Words
rail
exhibits the lowest Use synonyms
figures
. Use synonyms
Additionally
, it is evident that the Linking Words
number
of Use synonyms
incidents
consistently exceeds the Use synonyms
number
of Use synonyms
injuries
.
Examining the modes of transportation, demand response consistently exceeds 150 Use synonyms
million
Use synonyms
PMT
for both Use synonyms
incidents
and Use synonyms
injuries
. Use synonyms
In contrast
, Bus, Linking Words
Light
Use synonyms
rail
, Heavy Use synonyms
rail
, and Commuter Use synonyms
rail
register Use synonyms
figures
below 100 Use synonyms
million
Use synonyms
PMT
. It is noteworthy that Use synonyms
Bus
consistently reports a higher Correct article usage
the Bus
number
of Use synonyms
injuries
compared to all Use synonyms
rail
-mode transportations, Use synonyms
while
its incident count is slightly lower than that of Linking Words
Light
Use synonyms
rail
.
Turning attention to the Use synonyms
number
of Use synonyms
incidents
and Use synonyms
injuries
, Commuter Use synonyms
rail
emerges as the safest mode with the lowest Use synonyms
figures
, approximately 25 Use synonyms
million
Use synonyms
PMT
. The disparity in incident counts between Heavy Use synonyms
rail
and Use synonyms
Light
Use synonyms
rail
is minimal. Use synonyms
Furthermore
, Heavy Linking Words
rail
, Bus, and Use synonyms
Light
Use synonyms
rail
exhibit relatively similar incident Use synonyms
figures
, which Use synonyms
then
surge significantly, reaching levels five times higher than those.Linking Words