
The given bar chart compares the old of the citizens of a certain territory from 1990 to 2020.
Overall
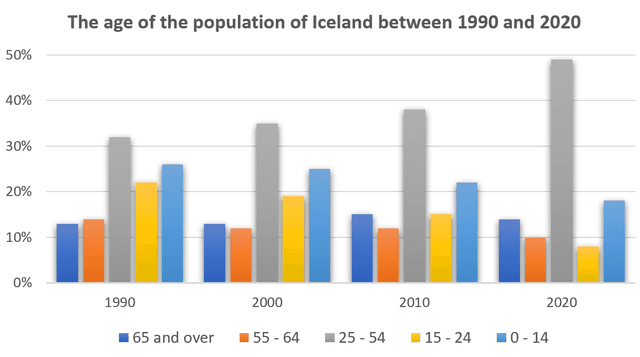
, what stands out from the graph is that people who experienced the age of 25 to 54 were the most than other groups over the given period. Linking Words
In addition
, all the age groups saw a downward trend or stayed approximately at the same rate, except for 25-54.
In 1990, the 25 to Linking Words
54 year old
people had the highest rate of the population at just above 30 percent. Add a hyphen
54-year-old
Then
the figure witnessed an upward trend until peaked at just under 50% in 2020. If we look at the ratio of population for infants to Linking Words
14 years old
teenagers, at first there was a slight drop of about 1 % and after Correct your spelling
14-year-old
that
it levelled off at close to 20% in 2020.
With respect to other age assemblages, as for 15-24, there was a falling trend and ended up at almost 8%. Turning to 65 and over and 55-64, both reached Add a comma
that,
at
around 13 and 10 Change preposition
apply
percent
, respectively.Change the spelling
per cent