
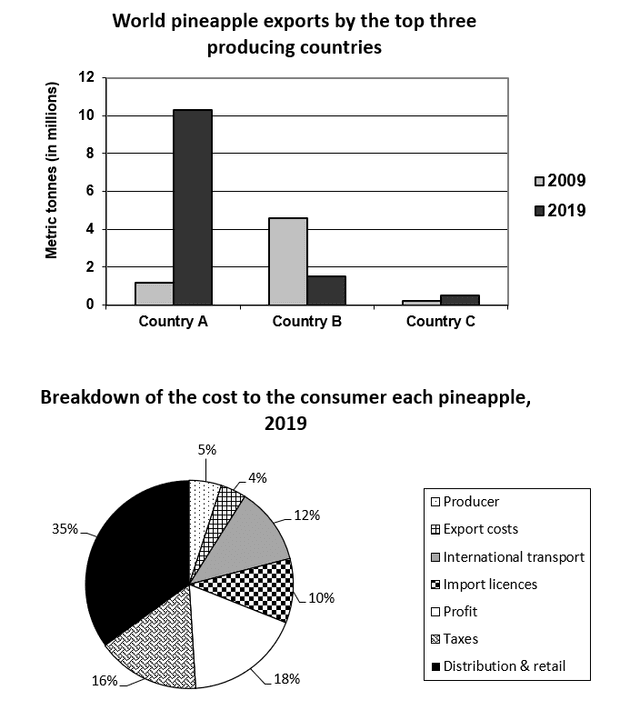
The introduced line graph and pie chart illustrate the amount of exported pineapples by the three top-producing countries in 2009 and 2019, and the
percentage
of consumer value of each fruit in 2019.
Use synonyms
According to
the statistics, in 2009 Linking Words
country
B was the leader in Use synonyms
pineapple
export, Use synonyms
however
, Linking Words
country
A took Use synonyms
this
position ten years later. Linking Words
In addition
, Linking Words
country
C lagged behind these countries during the whole term. It is Use synonyms
also
observed, that half of the cost to the consumer of each Linking Words
pineapple
was taken by profit and distribution with retail.
Looking more closely at the details, Use synonyms
country
A produced and exported about 2 metric tons of Use synonyms
pineapple
in 2009, Use synonyms
while
Linking Words
country
C took the lowest position on the list of the top-producing countries both in 2009 and 2019 (less than 1 million metric tons of fruits per year). Use synonyms
Moreover
, Linking Words
country
A was the leader in export production in 2019 and reached over х10 metric tons of exported pineapples. At the same time, the Use synonyms
pineapple
production rapidly reduced by a third in 2019 in Use synonyms
country
B.
The data in the pie chart reveals, that in the breakdown of the cost to the Use synonyms
consumer
profit amounted particularly a half of the Add a comma
consumer,
percentage
of distribution and retail, making 35%. Use synonyms
Furthermore
, almost one-fifth (16%) came from taxes in the price breakdown. It is noteworthy, that import licenses and international transport accounted for one-tenth of the Linking Words
percentage
, 12% and 10% respectively. In fact, exports cost and producer was the smallest Use synonyms
percentage
of the breakdown, comprising 4% and 5%.Use synonyms