
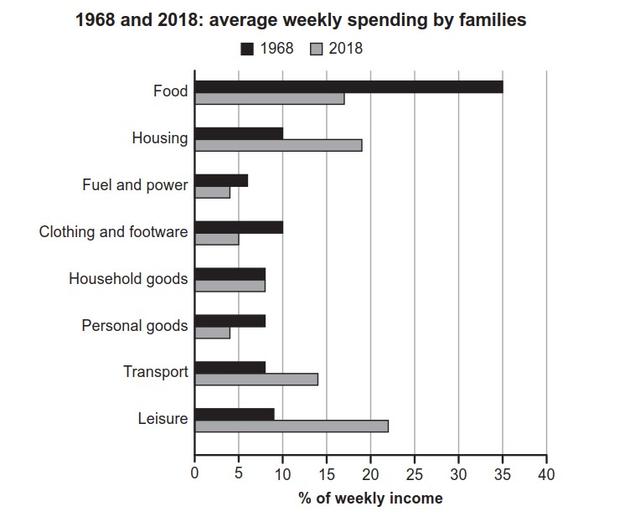
The bar chart compares the allocation of
families
' weekly incomes to various types of Use synonyms
expenditure
between 1968 and 2018. Use synonyms
Overall
, Linking Words
families
shifted their lion's share of outcomes from food in 1968, to leisure activities in 2018.
In the baseline year, Use synonyms
families
' food expenses constitute 35% of their Use synonyms
overall
Linking Words
outcome
, dwarfing the other Use synonyms
expenditure
brackets by a significant margin. Use synonyms
Moreover
, the expense for housing is only a mere 10% of the total Linking Words
outcome
, Use synonyms
this
differs greatly from households in 2018 that allocated a near 20% of the Linking Words
outcome
only for housing. Use synonyms
Furthermore
, other types of Linking Words
expenditure
were not significant to households in 1968, counting to less than 10 per cent of the total Use synonyms
outcome
, each.
The consumption pattern drastically changed in 2018. Use synonyms
Families
are inclined to do various leisure activities, consuming almost 25% of their money. Use synonyms
Expenditure
on housing Use synonyms
also
increased in 2018 to almost 20%. Other expenditures Linking Words
also
saw changes over the year, albeit marginally.Linking Words