
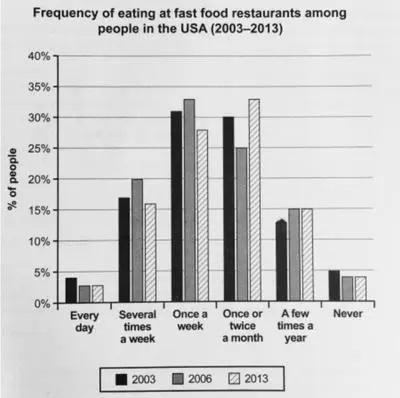
The bar chart illustrates the proportion of American
people
who ate fast Use synonyms
food
at restaurants from 2003 to 2013.
Use synonyms
Overall
, in 2003, the largest percentage of American Linking Words
people
ate fast Use synonyms
food
once a Use synonyms
week
, Use synonyms
whereas
the daily consumption of fast Linking Words
food
had the least popularity. Use synonyms
Moreover
, in 2006, the popularity of fast Linking Words
food
increased compared to 2003 in several Use synonyms
times
a Use synonyms
week
, once a Use synonyms
week
, and a few Use synonyms
times
a year groups. It can be implied that the proportion of Use synonyms
people
who refrained from eating fast Use synonyms
food
in 2006 was equal to that of 2013.
In 2003, most American Use synonyms
people
preferred to eat fast Use synonyms
food
on a weekly basis with nearly 31%, Use synonyms
while
the lowest percentage of Linking Words
people
went to fast Use synonyms
food
restaurants with 4%. Use synonyms
Furthermore
, in 2006, the figures for fast Linking Words
food
consumption several Use synonyms
times
a Use synonyms
week
, once a Use synonyms
week
, and a few Use synonyms
times
a year were higher than in 2003 at 20%, 33%, and 15%, respectively. Use synonyms
Finally
, it is worth noting that the proportion of Linking Words
people
who were reluctant to eat fast Use synonyms
food
in 2006 and 2013 was equal to approximately 4%.Use synonyms