The graph below shows the number of overseas visitors to three different areas in a European country between 1987 and 2007

The graph below shows the number of overseas visitors to three different areas in a European country between 1987 and 2007
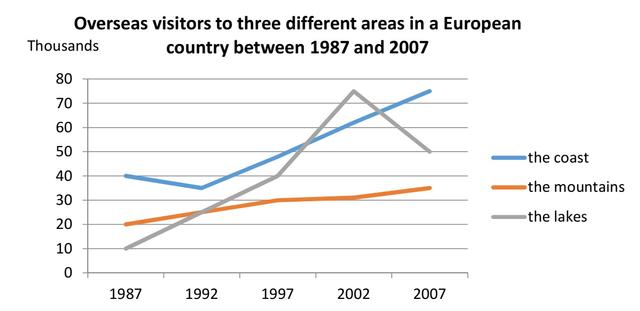
The line chart illustrates the tourists number of in three places in the European nations from 1987 to 2007.
overall
, most visitors were on the beach.
While
,
Remove the comma
apply
show examples
other places had fewer people.
However
, the number of foreign individuals increased in all places
according to
the period given. On the one hand, There was a steady increase in the number of coastal visitors from 40
thousand
to around 75
thousand
in 2007.
Moreover
, the tourists of to the lake grew dramatically from 10
thousand
to over 75
thousand
in 2002 before declining to 50 50,000 in 2007.
on the other hand
, in 1987, 20
thousand
people visited the mountain,
then
went up slightly to approximately 35
thousand
in 2007.
Submitted by hafsaalbadi199 on

Unauthorized use and/or duplication of this material without express and written permission from this site’s author and/or owner is strictly prohibited. Excerpts and links may be used, provided that full and clear credit is given to Writing9 with appropriate and specific direction to the original content.

Sentences: Add more complex sentences.
Common mistake: Your writing should be 150-250 words.
Vocabulary: Replace the words thousand with synonyms.
Vocabulary: Rephrase the word "number of" in your introduction.
Vocabulary: The word "number of" was used 3 times.
Vocabulary: The word "increased" was used 2 times.
Topic Vocabulary:
  • overseas visitors
  • number of
  • areas
  • European country
  • between
  • 1987 and 2000
  • graph
  • introduce
  • overview
  • trends
  • describe
  • analyze
  • compare and contrast
  • summarize
  • main findings
What to do next:
Look at other essays: