
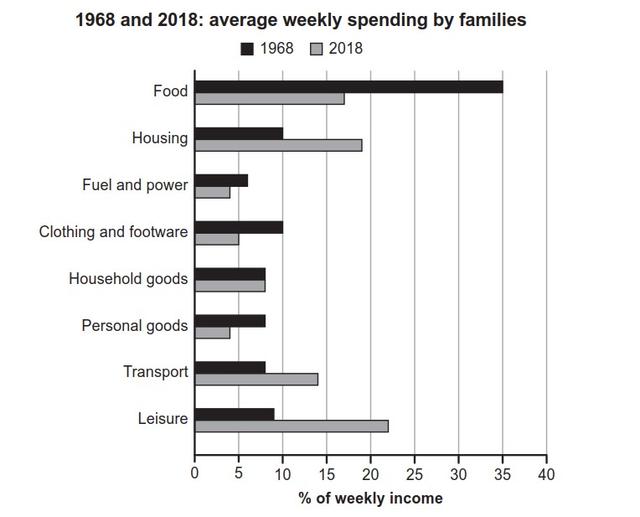
The bar chart compares the percentage of weekly income on the average expenditures of families,
according to
the year(1968 and 2018) and eight categories.
Linking Words
Overall
, it is noticeable that Linking Words
food
was the highest expense by families in 1968, Use synonyms
while
in 2018, entertainment spending was higher than Linking Words
food
, and the spending on Use synonyms
food
was reversed from 1968.
To be specific, in 1968, the income spent on Use synonyms
food
stood at 35%, two times higher than in 2018. Regarding housing and clothing, which involved footwear, 10% of salary was spent on both in 1968; Use synonyms
however
, people tended to spend more on the former and less on the latter in 2018, approximately 18% and 5%, respectively.
Linking Words
On the other hand
, there was the same percentage of spending on household goods, personal goods and transport at around 8% in 1968, compared to 2018, personal goods reduced by half, and transport rose to 14%. Linking Words
Furthermore
, leisure expenses went up from just 9% to 23%, being a dramatic growth among the eight categories from the given year.Linking Words