
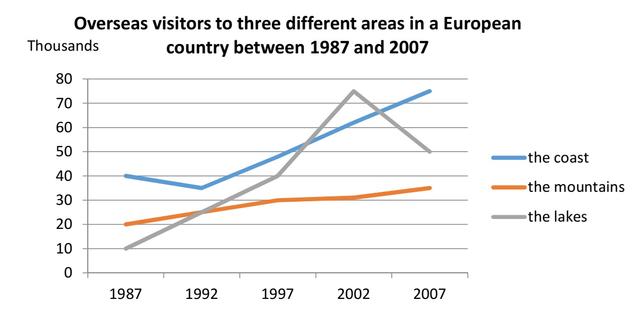
The line graph depicts how many tourists visited three distinct tourism objects in a European region from 1987 to 2007.
From an
overall
perspective, Linking Words
it is clear that
the international visitor count in all places showed an upward trend during Linking Words
this
period, with the lakes having the most significant growth among others, Linking Words
whereas
the mountains emerged as the least.
In 1987, there were 10,000 people enjoying lakes in Europe, which was the lowest compared to other areas. Linking Words
However
, Linking Words
this
number plumbed to an all-time high (around 75,0000) in the following fifteen years, before decreasing to 40,000 Linking Words
at the end
of the timeline.
In comparison, those coasts started with 40,000, which was the highest quantity among others, falling by almost 5,000 in the next five years, prior to growing considerably to over 70,000 in 2007. Linking Words
In addition
, the mountains rose slightly during Linking Words
this
time surveyed, beginning with 20,000 and finishing with approximately 35,000.Linking Words