
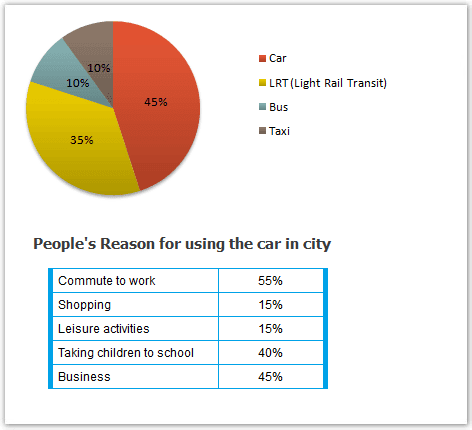
The pie chart demonstrates which types of four distinct transportation facilities individuals prefer,
while
the table illustrates particular reasons why people in Edmonton choose cars in the city.
From an Linking Words
overall
perspective, Linking Words
it is clear that
automobiles are the most common mode of transport among communities, as the majority of Edmonton's citizens drive them to work, Linking Words
whereas
the least rely on them for refreshment and grocery-shopping purposes.
Looking at the details of the first graph, 45% of societies ride cars for their daily commute, which is the highest proportion among others. Linking Words
In addition
, 35% of the respondents made use of light rail transit (LRT). Linking Words
However
, those who depend on buses and taxis receive the least allocation, with 10% each.
Moving to the second diagram, 55% of employees go to their workplace by vehicle, which is the most prominent motive individuals choose. The other factors, Linking Words
such
as taking children to school and business, accounted for 40% and 45%, respectively, where, Linking Words
in contrast
, travel for shopping and leisure activities become minors, equaling 15% each.Linking Words