
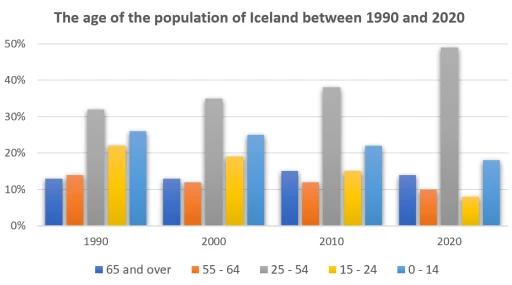
The bar chart illustrates the data about the
age
of residents of Iceland over a 30-year period between 1990 and 2020.
Use synonyms
Overall
, what stands out from the graph is the number of people aged 25-54 was always greater than other Linking Words
age
ranges. Use synonyms
Moreover
, the elderly population remained almost the same throughout the period in question.
Looking at the details, the percentages of the young (15-24) and children (0-14) experienced the same trend. As regards children, their number was nearly 26% in 1990. In 2000, it remained unchanged, Linking Words
however
, the percentage started declining steadily, finishing at around 19% in 2020. Linking Words
Likewise
, the young population’s percentage was 21% in 1990, which Linking Words
further
plummeted by 12% in 2020.
In terms of the remaining Linking Words
age
ranges, the figure for the seniors and middle-aged people faced a minor change. Use synonyms
While
the elderly had a negligible fluctuation, ending up at 13% in 2020, the figure for middle-aged people had a steady drop of 4% over the time frame. Linking Words
In contrast
, the population with an Linking Words
age
range of 25-50 experienced a significant rise in numbers. The percentage increased by 8% in 2010, Use synonyms
then
it soared to just under 49% in 2020.Linking Words