
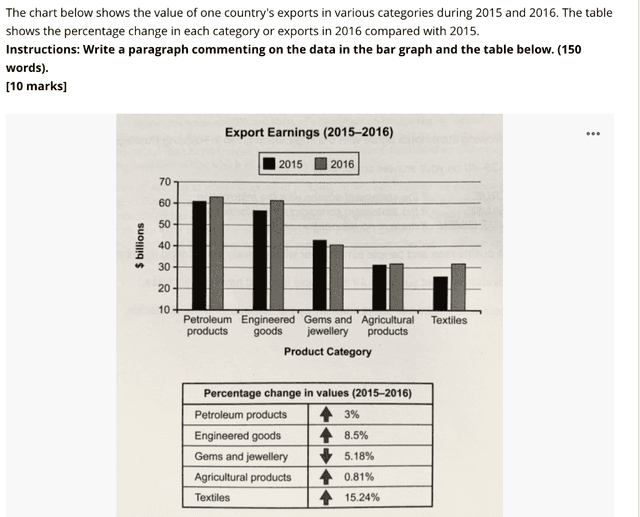
The charts below illustrate the distribution of various export products in an unnamed country over a one-year period.
Overall
, there was a major change in the percentage. Within five categories, there were four of them that experienced an increase, Linking Words
along with
one product that had a significant decline.
The share of Petroleum, as the highest commodity at the outset of the period, remained in the first place with a rise of 3% in 2016. Textiles, Linking Words
on the other hand
, had the most considerable growth of 15.24%, after occupying the least popular item rank to be exported in 2015. Linking Words
Whereas
, Engineered Goods which experienced a substantial climb of 5.18%, became the second highest export elevation.
Following these escalations, Agricultural commodities had the slightest rise with only 0.81%. Linking Words
Furthermore
, the Linking Words
last
assets, namely Gems and Jewellery, encountered a sharp downturn with 5.18%, and became the only export product that had a decrease between 2015 and 2016.Linking Words