
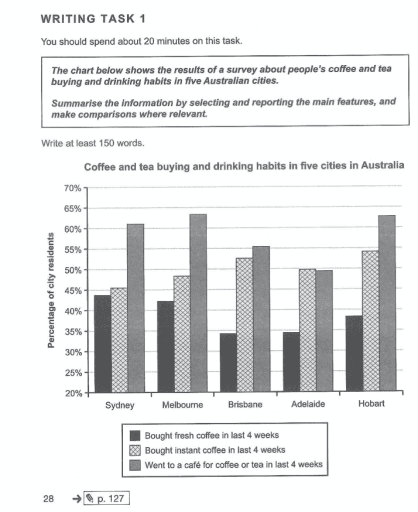
The bar chart illustrates the proportion of Australian
coffee
and Use synonyms
tea
consumption and purchasing in five different cities (Sydney, Melbourne, Brisbane, Adelaide and Hobart) in Australia.
Use synonyms
Overall
, Linking Words
it is clear that
the percentage of people who went to a café for Linking Words
coffee
and Use synonyms
tea
in the Use synonyms
last
month was higher than buying Linking Words
tea
or Use synonyms
coffee
in four cities. Use synonyms
However
, the figures for buying instant Linking Words
coffee
and going to a café were nearly equal in Adelaide during the same time. Use synonyms
Furthermore
, the popularity of going to a café in Melbourne was the highest among other cities.
It can be seen that, in Melbourne, the consumption of Linking Words
coffee
and Use synonyms
tea
in a café was the largest at approximately 64%. Use synonyms
Moreover
, in Brisbane, the proportion of buying instant Linking Words
coffee
and that of going to a café was equal to 50%. Use synonyms
Finally
, the figures for purchasing fresh Linking Words
coffee
in Brisbane were equal to that of Adelaide at 34%.Use synonyms