
In
this
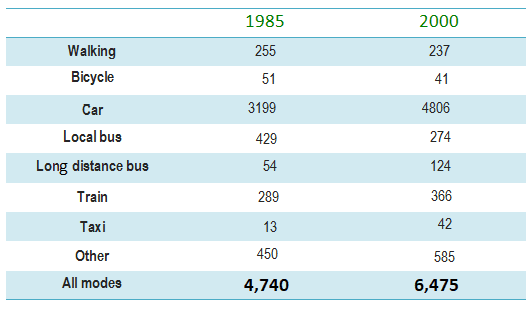
case, The provided table illustrates about travel mode change in England between 1985 and 2000.
Linking Words
Overall
, The Linking Words
distance
in miles travelled per person per year increased in aggregate between 1985 to 2000. Use synonyms
Furthermore
, there are almost all modes got increment Linking Words
distance
in 2000 except walking, bicycle, and local bus.
Use synonyms
Accordingly
, the Car is the most favourable either in 1985 or 2000. People could travel an average of 4806 miles a year with that vehicle, which is more than 80% of the total Linking Words
distance
. Use synonyms
On the contrary
, in 2000 bicycles and taxis had a low level of demand. Despite that condition, the usage of taxis had grown significantly, from 13 to 42 per year per person.
Linking Words
Besides
the demand growth, the data indicate that in 2000, there was a potential mode switch from local buses to long-Linking Words
distance
buses and trains. Approximately 150 miles decreased on the local bus, which shifted the mode to the other listed public transportation which gets a higher number of range.
Use synonyms
To conclude
, The travel Linking Words
distance
in 2000 is higher than 15 years before and there is a potential switch in public transport options.Use synonyms