
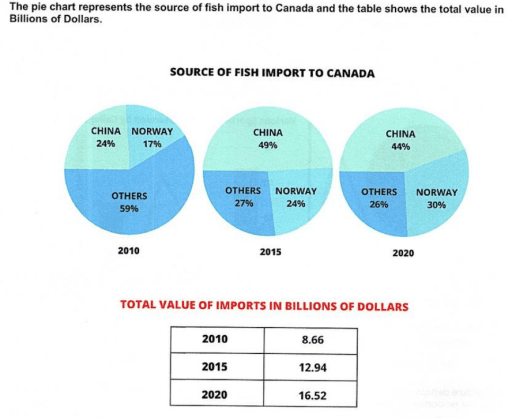
The pie charts illustrate the proportion of the share of fish
imports
by Use synonyms
Canada
from Use synonyms
the
different parts of the world over numerous years. Correct article usage
apply
Moreover
, the table depicts the total Linking Words
value
of Use synonyms
imports
in billions of Use synonyms
dollars
.
Use synonyms
Overall
, it is evident from the Linking Words
overall
analysis that Linking Words
Canada
was importing its most fish from other countries in 2010 but the percentage from Use synonyms
China
increased significantly in 2015 and 2020. Use synonyms
Also
, the table depicts the total Linking Words
value
of Use synonyms
import
which was rising with time.
In 2010, Fix the agreement mistake
imports
Canada
imported 24% of its total fish demand from Use synonyms
China
, 17% from Norway, and 59% from other nations. In 2015, Use synonyms
China
's share increased substantially and climbed to 49%. Use synonyms
Similarly
, the percentage of Norway soared to 24% Linking Words
whereas
Linking Words
imports
from other areas Use synonyms
fel
to 27%. Correct your spelling
fell
Share
of Correct article usage
The share
China
and 'others' in 2020 declined marginally to 44% and 26%, respectively. Use synonyms
However
, the figures for Norway increased to 30% in Linking Words
overall
Linking Words
imports
by Use synonyms
Canada
.
The total Use synonyms
value
of Use synonyms
imports
from Use synonyms
Canada
has been increasing over time. The volume in 2010 was 8.66 billion Use synonyms
dollars
. The figures for 2015 increased drastically and touched 12.94 billion Use synonyms
dollars
. In 2020, the total Use synonyms
value
of Use synonyms
imports
soared to 16.52 billion Use synonyms
dollars
.Use synonyms