
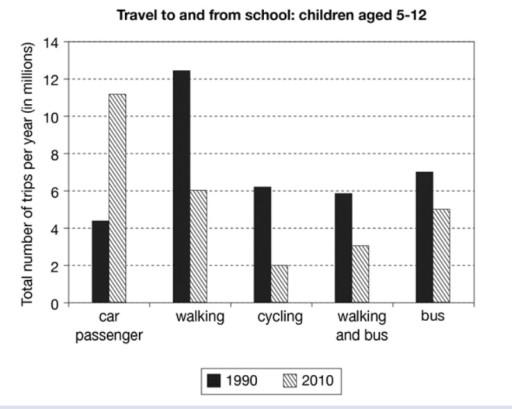
The bar chart below represents the number of trips, in millions taken by kids aged 5-12 in one nation in 1990 and 2010 to get to and from their education facilities using different types of transportation.
Overall
, walking and car passages had the highest recordings in both years Linking Words
while
other types of transportation recorded ab average use.
Walking was the most favourable mode of transport in 1990 with over 12 Linking Words
million
travel followed by the use of Use synonyms
bus
with just under 8 Use synonyms
million
travelling. In 1990, cycling walking and Use synonyms
bus
recorded 6.1 Use synonyms
million
and close to 6 Use synonyms
million
trips respectively. The use of car passengers was the least favourite with a minimum of 4.1 Use synonyms
million
per year.
In 2010, there was a sharp increase of 11 Use synonyms
million
journeys taken using a car passenger and a drastic fall in walking to 6 Use synonyms
million
journeys. A slight fall to almost 5 Use synonyms
million
was recorded for the usage of the Use synonyms
bus
whilst both cycling and walking and the Use synonyms
bus
showed a steady decrease to 2 Use synonyms
million
and 3.5 Use synonyms
million
trips taken respectively.Use synonyms