
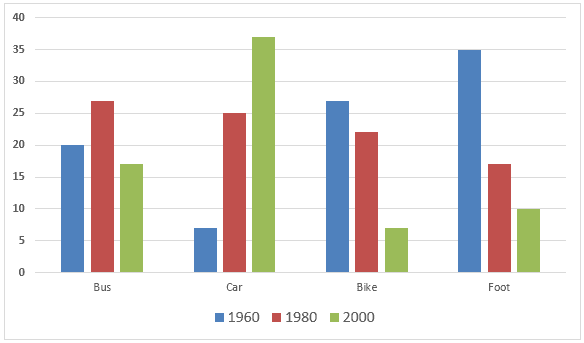
The bar graph depicts data about the type of transport for commuting from and to workplaces in 1960, 1980 and 2000, in a European city.
Overall
, the trend changed over time for each system of transportation.
To start with, in 1960 people used to prefer eco-friendly transport Linking Words
such
as bikes and footpaths with percentages of 35 and around 25, respectively, Linking Words
however
, the car was the least transportation chosen. Linking Words
On the other hand
, by the 80 decade, public transport was mainly used with values just above 25 per cent, followed by car and bike usage. In the year 2000, private commuting by car was approximately 38%, showing a sudden rise, Linking Words
nevertheless
, public alternatives for transportation by biking or walking dropped drastically.
In conclusion, types of committing have widely changed, during the past decades showing more usage of non-vehicle alternatives, Linking Words
nonetheless
, they were replaced by personal options contributed by automobiles. Linking Words
Besides
, non-polluting and healthy options given by cycling or walking decreased gradually until their lowest value in 2000.Linking Words