
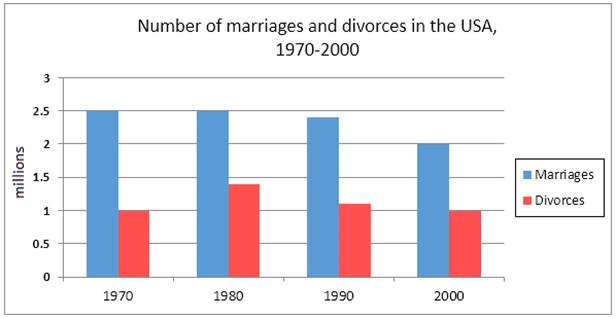
The first chart illustrates the alteration in the number of marriages and divorces in the USA over a 30-year period from 1970 to 2000. The second chart demonstrates
proportion
of American adults’ marital statuses in 1970 and 2000.
Generally, the numbers of marriages are higher than the Add an article
the proportion
divorces
rates over a 30-year period. Change the noun form
divorce
In addition
Linking Words
to
in 1970 and 2000, the married people are more than 50 Change preposition
apply
percent
and Change the spelling
per cent
maximum
indicator on the chart. Correct article usage
the maximum
Although
during the first 10 years, the number of marriages remained constant at 2.5 billion, it decreased slightly from 1990 to 2000.
Linking Words
Whereas
, Linking Words
divorces
rates have increased by almost half a million in 10 years. Change the noun form
divorce
However
, itLinking Words
a
little declined in Add a missing verb
has a
Linking Words
last
Correct article usage
the last
over
Change preposition
apply
10-year
period. Add an article
a 10-year
Percentage
of never married, widowed and divorced did not exceed 20 Correct article usage
The percentage
percent
in two years. Change the spelling
per cent
Nevertheless
, The lowest of these three statuses is divorced and Linking Words
conquer
less than 10 Correct subject-verb agreement
conquers
percent
. The number of widows is Change the spelling
per cent
also
the same even though divorce Linking Words
is
very low in 1970.Wrong verb form
was