
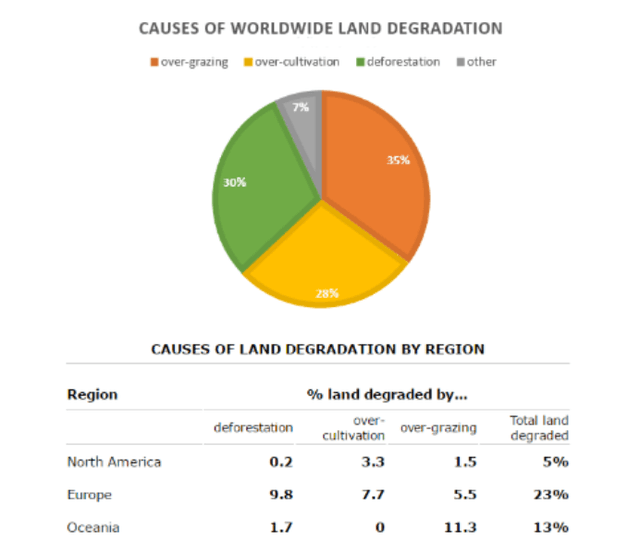
The graphs illustrate the proportion of activities that affect the growth of crops in both worldwide and three regions in the world.
Overall
, Linking Words
it is clear that
the reason for degraded land is coming from over-grazing by cows which Oceania affected the most Linking Words
while
Europe has land degradation more than other parts of the world.
In a pie chart, over-grazing occurs from herbivores Linking Words
for example
cows occupy 35%. Logging and over-agriculture almost have the same per cent which represents 30% and 28% respectively. Linking Words
However
, the cause of other issues that affect the soil is only about 7%.
Oceania's over-grazing registers 11.3% which is the highest of all regions but the earth in Linking Words
this
part of the world is not affected by over-cultivation. Europe has total degraded soil higher than others which is nearly one-quarter of its land and deforestation is the main issue for their low-quality soil and it is mainly caused by overcrops. Linking Words
Moreover
, North America's lands seem to have the least degradation, at 5%, and overgrowth of crops is their main problem same as in Europe.Linking Words