
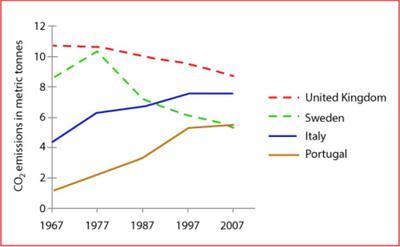
The provided chart depicts
mean
carbon dioxide Correct article usage
the mean
emmissions
to each individual in four countries, including Correct your spelling
emissions
United
Kingdom, Correct article usage
the United
Sweden
, Italy, and Portugal Use synonyms
in
1967 to 2007. The trend of the given chart are gradual increase Change preposition
from
of
Italy and Portugal, Change preposition
in
gradual
Correct article usage
a gradual
declinement
Correct your spelling
decline
of
Change preposition
in
United
Kingdom, and volatility Correct article usage
the United
of
Change preposition
in
Sweden
.
At the start of the time frame, Italy and Portugal Use synonyms
has
the least amount of air pollution emissions Wrong verb form
had
by
around 4 and 1.5 Change preposition
apply
tonnes
respectively. Both Use synonyms
emmissions
skyrocketed in 1977 to about 6 Correct your spelling
emissions
tonnes
in Italy and 2 Use synonyms
tonnes
in Portugal. Use synonyms
Furthermore
, those countries Linking Words
has
increased gradually and reached around 7 Change the verb form
have
tonnes
in Italy and 5 Use synonyms
tonnes
in Portugal.
Use synonyms
United
Kingdom and Correct article usage
The United
Sweden
showed Use synonyms
similar
Correct article usage
a similar
trend
by having Fix the agreement mistake
trends
a
lower Correct article usage
apply
emmissions
Correct your spelling
emissions
at
Change preposition
in
the
2007, compared to 1967. Change the article
apply
However
, Linking Words
Sweden
's CO2 production surged between 1967 and 1977, Use synonyms
with
approximately 8 Change preposition
from
tonnes
to 10 Use synonyms
tonnes
. Use synonyms
Linking Words
Furthermore
it decreased gradually and reached around 6 Add a comma
Furthermore,
tonnes
Use synonyms
at the end
of the time frame.Linking Words