
The line graph compares two types of
shops
which the Use synonyms
number
of closed and new opened in a country in seven years
Use synonyms
Overall
, Linking Words
shops
that closed dropped significantly in that period but Use synonyms
this
rate grew Linking Words
at the end
of the term. The Linking Words
number
of closed Use synonyms
shops
did not observe very much Use synonyms
however
, it declined final stage.
The Linking Words
number
of closed Use synonyms
shops
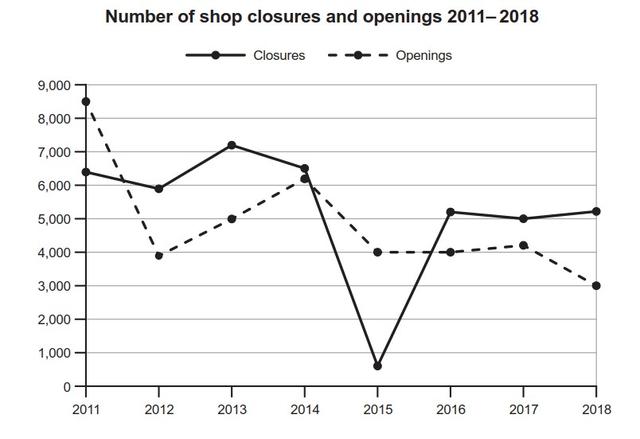
changed its grade several times between 2011 and 2014 from 5500 to 7100 respectively but the line graph shows that its amount had a significant reduction in 2015 by nearly 500. At that time opens did not have as quick plunge. After that time closures grew just above 5k in 2016. The next 3-year closure grade changed between 5k and 5,2 Use synonyms
k
The amount of opened Use synonyms
shops
decreased sharply to 4k in 2012 Use synonyms
then
it increased to 6k from 2012 to 2014. At that time the total of department stores started to drop by 4k and 4,1k respectively. In 2018 it reached its lowest point in 8 years approximately 3k in 2018.
The graph below shows the Linking Words
number
of Use synonyms
shops
that closed and the Use synonyms
number
of new Use synonyms
shops
that opened in one country between 2011 and 2018.Use synonyms