
The
given
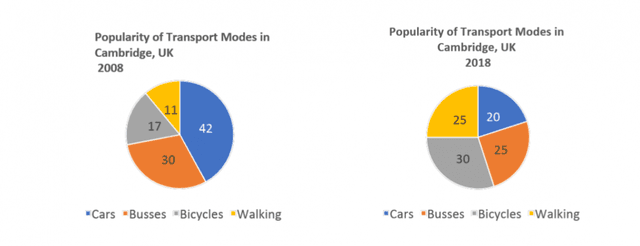
pie charts illustrate the most frequently used forms of transportation in Cambridge, United Kingdom, in two different years, 2008 and 2018. Verb problem
apply
Overall
, it can be seen that cycling and walking gained more popularity, Linking Words
while
the use of cars and buses witnessed a decline.
Linking Words
Initially
, in 2008, the primary mode of transportation in Cambridge was the car, accounting for the largest proportion of 42% of the population. Following closely behind were buses, which were utilized by less than a third of the residents. Linking Words
However
, in 2018, Both modes experienced a decline, with the proportion of Linking Words
cars
users dropping significantly to 20%. Meanwhile, bus usage experienced a minor reduction, settling at 25% of the choices.
Change the noun form
car
Conversely
, Linking Words
the
bicycles and walking Correct article usage
apply
initially
emerged as the two least preferred options, comprising a mere 11% and 17% respectively. Linking Words
Thereafter
, both experienced a notable increase in popularity, with both modes increasing by nearly 15%. Walking represented 25%Linking Words
,
Remove the comma
apply
while
cycling made up the highest proportion at just under a third.Linking Words