
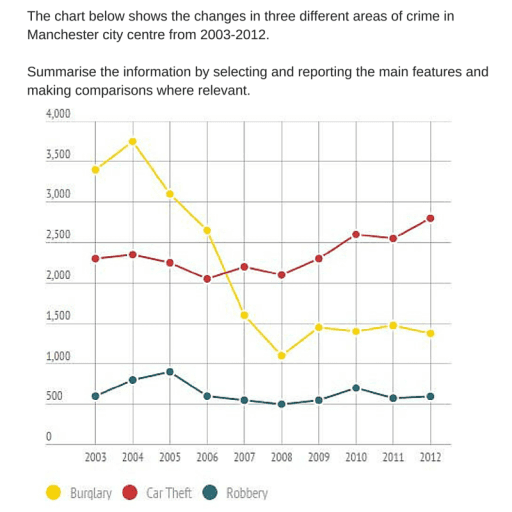
The line graph compares the incident's number of three crimes in the city between 2003 and 2012.
While
the Linking Words
cases
of burglary decreased, the figure for car theft and robbery stayed stable with some fluctuations.
As the graph shows, nearly 3500 burglaries were committed in 2003. Next year, Use synonyms
this
indicator increased gradually to about 3700 Linking Words
cases
in 2004. Use synonyms
Then
, the occasions of crime decreased steadily to hit the lowest point at 1200 Linking Words
cases
in 2008. After that, it grew considerably in 2009 and remained unchanged until 2012. Regarding car theft, there were about 2800 crimes in 2003. It dropped slowly to 2000 Use synonyms
cases
in 2006. Use synonyms
Then
, it went up moderately with some variations to 2700 Linking Words
cases
in 2012.
Turning to robbery, it fluctuated quickly over Use synonyms
10-year
time period. In the beginning, 500 crimes occurred in 2003. Add an article
a 10-year
the 10-year
Then
, it had a slight rise to about 200 Linking Words
cases
. Afterwards, it continued its levelling off at 900 Use synonyms
cases
with quite a variation between 850 and 950 Use synonyms
cases
by 2012.Use synonyms