
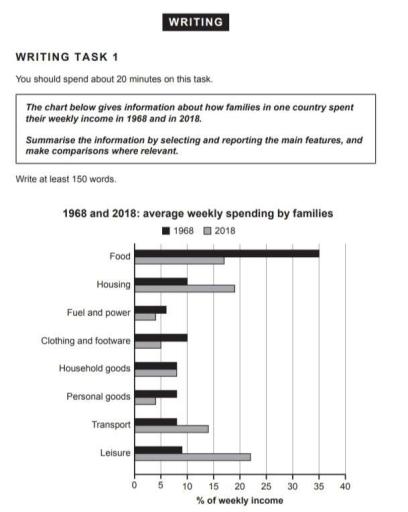
The column chart illustrates that households how spent their revenue on a weekly basis in a certain country in the years 1968 and 2018.
Overall
, it can be seen that the largest amount of money was spent on food in 1968, Linking Words
whereas
the figure for providing fuel and power was the lowest. Linking Words
Furthermore
, the proportions of income which was devoted to household goods were equal in these two years.
Linking Words
First,
the percentage of weekly income which was spent on food in 1968 was the highest at 35%, Linking Words
while
the expenses of fuel and power were the lowest at nearly 6% in the same year. Linking Words
Additionally
, the amount of money which was allocated to household goods was equal in both years at approximately 8%. In 2018, the highest percentage of weekly income was spent on leisure activities with roughly 22%. Linking Words
Furthermore
, Linking Words
this
year, people cared about personal goods and Linking Words
also
fuel and power equally at 4%. Linking Words
Finally
, it is worth noting that the amount of money which was devoted to transport and leisure purposes in the year 1968 was approximately equal to 9%.Linking Words