
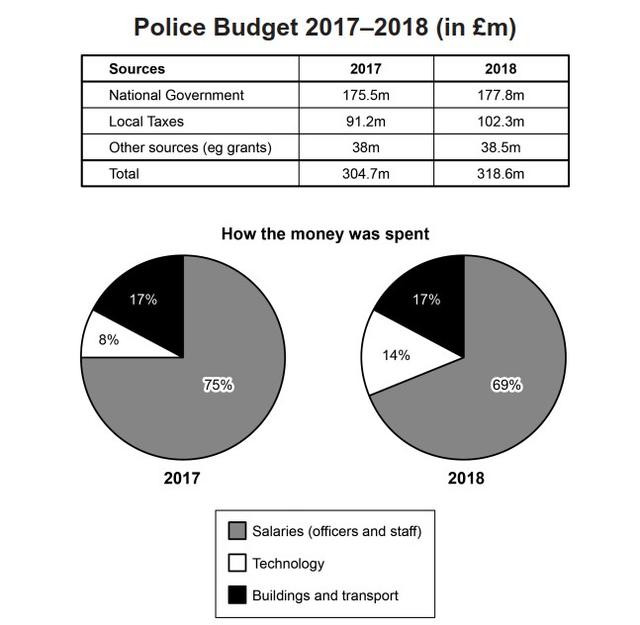
The table and pie chart
provide
data on the police allowance in 2017 and 2018 in a place of Britain. The table illustrates how the money Change the verb form
provides
earned
and the pie chart shows where it was spent.
Add a missing verb
was earned
Overall
, Linking Words
it is clear that
the budget was offered from three sources which consist of Linking Words
National
government, local taxes and others. It is Correct article usage
the National
also
worth mentioning that the police expended money on three main groups of expenses (salaries for officers and staff, technology and building and transport)
Linking Words
To begin
with, 175, 5 Linking Words
million
came from Use synonyms
national
government in 2017 and Add an article
the national
this
number increased to 177, 8 Linking Words
million
in 2018. Use synonyms
Conversely
, there was an approximately 11. 1 Linking Words
million
change in local taxes from 91. 2 Use synonyms
million
to 102. 3 Use synonyms
million
and the total budget grew up to 13. 9 Use synonyms
million
.
Looking at the pie chart, we can see that 75% of Use synonyms
budget
was spent on salaries in the first year and it decreased to 69% by 2018. Spending money on technology was 8% at first and there wasAdd an article
the budget
6
% Correct article usage
a 6
change
to 14% Correct your spelling
chance
at the end
of the given period.Linking Words