
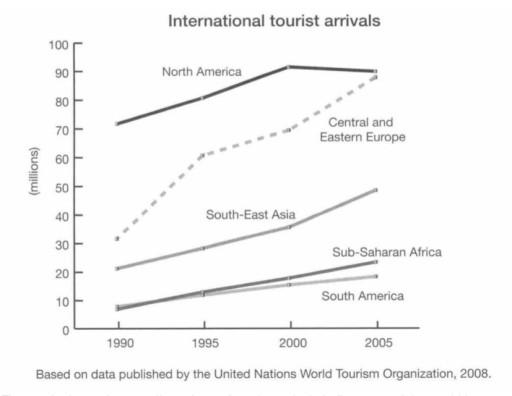
The line chart compares how many overseas
tourist
arrivals in five places including North- Use synonyms
America
, Central and Eastern Europe, South East Asia, Sub-Saharan Africa and South Use synonyms
America
over the 15-year period from 1990 to 2005.
Generally speaking, most of the given areas experienced an upward trend. What stands out is that the total number of international Use synonyms
tourist
arrivals in North- Use synonyms
America
was the highest, compared to other Use synonyms
tourist
destinations.
In the Use synonyms
last
decade of the twentieth century, the figure for North Linking Words
America
was twice as much as four other places, at more than 70 Use synonyms
million
. The number of Use synonyms
tourist
arrivals in Centre and Eastern Europe followed with about 31 Use synonyms
million
, Use synonyms
whereas
in Sub-Saharan Africa and South Linking Words
America
, these numbers were only less than 10 Use synonyms
million
each.
Use synonyms
However
, the trend saw a significant change by the turn of the twenty-first century. North Linking Words
America
experienced a steady increase until it reached a peak at around 90 Use synonyms
million
in 2000 Use synonyms
then
slightly decreased in the next 5 years. Linking Words
By contrast
, the figure for Central and Eastern Europe rose considerably and was almost equivalent to North Linking Words
America
in 2005. Use synonyms
While
South East Asia's number went up to less than 50 Linking Words
million
, the figure for Sub-Saharan Africa was a bit higher than South Use synonyms
America
's by 5 Use synonyms
million
.Use synonyms