
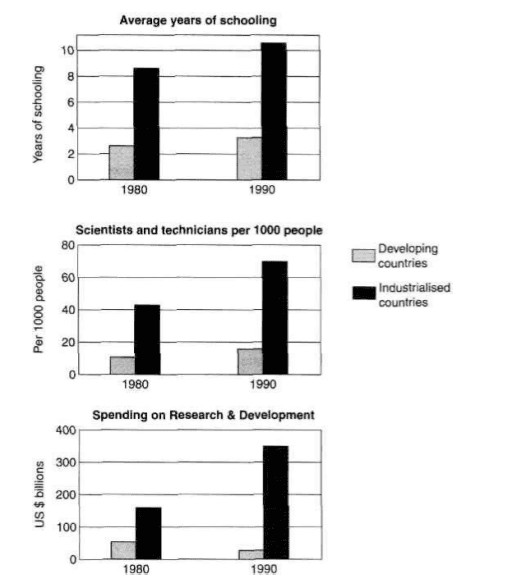
The bar charts illustrate the average years of schooling, scientists and technicians per 1000 people and
also
the participation levels in research and development in developing and industrialised countries during 1980 and 1990.
Linking Words
Overall
, the mentioned divisions are more in the industrialised regions and it is less in the developing places.
In 1980, the average years of schooling were around 2.1% in developing countries and 8% in industrialised countries. Linking Words
However
, in a decade Linking Words
this
has risen to almost 3.8% in developing and nearly 11% in industrialised places. Linking Words
On the other hand
, in 1980, the Linking Words
percent
of scientist and technicians were almost 10% in developing and around 45% in industrialised areas. Replace the word
percentage
Whereas
, in 10 years Linking Words
this
percentage has elevated to nearly 16% in Linking Words
former
and 75% in the latter regions.
Correct article usage
the former
Finally
, people spending on research and development in developing areas were around 50% and those in industrialised are 150% in 1980. Linking Words
Moreover
, in 1990, in developing zones Linking Words
this
Linking Words
percent
has reduced to less than 20%, Replace the word
percentage
while
in Linking Words
latter
areas Correct your spelling
later
this
has risen sharply reaching around 350%.Linking Words