
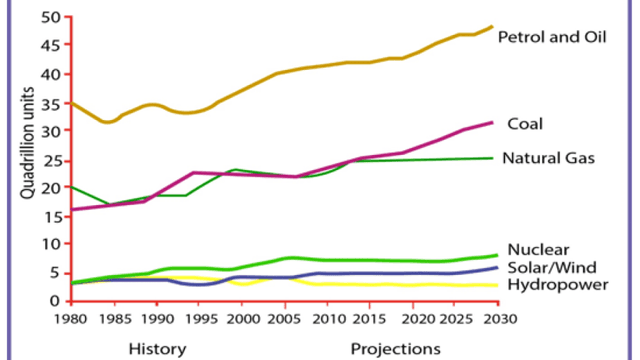
The line graph provides information about the quality of six different kinds of
energy
in the United States, measured by Use synonyms
quadrillion
Use synonyms
units
, between 1980 and 2030.
Use synonyms
Overall
, Linking Words
it is clear that
almost the Linking Words
amount
of Use synonyms
power
that people consumed, Use synonyms
such
as fuels, coal, natural Linking Words
gas
, nuclear and solar/Use synonyms
wind
is predicted to increase; Use synonyms
however
, the Linking Words
consumption
of Use synonyms
Use synonyms
hydro
Correct your spelling
hydropower
power
still will Use synonyms
steady
in fifty years from 1980 to 2030.
In 1990, fuel was the kind of Add a missing verb
be steady
energy
with the highest Use synonyms
consumption
, on average, people used 35 Use synonyms
quadrillion
Use synonyms
units
; Use synonyms
compered
to Correct your spelling
compared
approximated
20 Replace the word
approximately
quadrillion
Use synonyms
units
for natural Use synonyms
gas
, and 16 Use synonyms
quadrillion
Use synonyms
energy
for coal. Use synonyms
While
the figure for nuclear, solar/Linking Words
wind
and Use synonyms
Use synonyms
hydro
Correct your spelling
hydropower
power
Use synonyms
were
about the same as 4 Change the verb form
was
quadrillion
Use synonyms
units
. From 1980 to 2015 the quality of coal and natural Use synonyms
gas
jumped slowly, and both consumed around 25 Use synonyms
quadrillion
Use synonyms
units
. Meanwhile, petrol and oil continued to increase to 43 Use synonyms
quadrillion
Use synonyms
units
; the Use synonyms
amount
of nuclear, solar/Use synonyms
wind
and Use synonyms
Use synonyms
hydro
Correct your spelling
hydropower
power
consumed 6 Use synonyms
quadrillion
Use synonyms
units
, 5 Use synonyms
quadrillion
Use synonyms
units
and 4 Use synonyms
quadrillion
Use synonyms
units
respectively.
Over a five-year period between 2020 to 2025, the Use synonyms
amount
of natural Use synonyms
gas
, nuclear, solar/Use synonyms
wind
and Use synonyms
Use synonyms
hydro
Correct your spelling
hydropower
power
will remain stable at roughly 25 Use synonyms
quadrillion
Use synonyms
units
, 7 Use synonyms
quadrillion
Use synonyms
units
, 5 Use synonyms
quadrillion
Use synonyms
units
and 4 Use synonyms
quadrillion
Use synonyms
units
respectively. The Use synonyms
consumption
of fuel and coal will experience Use synonyms
upward
trend during the same period. Between 2025 and 2030, Petro and oil Correct article usage
an upward
consumption
will rise significantly to 49 Use synonyms
quadrillion
Use synonyms
energy
and it will be expected the highest figure in the line graph. Use synonyms
Besides
, the Linking Words
amount
of coal will climb considerably to 31 Use synonyms
quadrillion
Use synonyms
units
. Looking into the future, an inconsiderable increase in the Use synonyms
consumption
of nuclear and solar, with a rise of over 1 Use synonyms
quadrillion
Use synonyms
energy
in just five years from 2025 to 2030.Use synonyms