
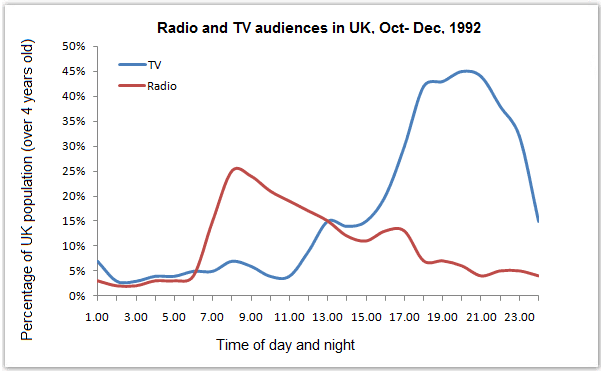
The line graph demonstrates the
percentage
of Use synonyms
people
in the UK who used two different electronic media, namely Use synonyms
television
and Use synonyms
radio
in a single day from October to December in the year Use synonyms
of
1992.
Change preposition
apply
Overall
, Linking Words
It is clear that
Linking Words
radio
had a high number of users in the morning, Use synonyms
while
Linking Words
television
had at the beginning of the night. Use synonyms
Also
, Linking Words
television
has been watched by more Use synonyms
people
who are over the age of 4 than the number of Use synonyms
people
listening to Use synonyms
Use synonyms
radio
.
At 1 O'Add an article
the radio
clock
, nearly 7% of Use synonyms
people
used Use synonyms
television
and Use synonyms
this
Linking Words
percentage
fluctuated in a range of around 3% to 5% until 11 am. The number of users Use synonyms
then
slightly increased to 15% at 13 O'Linking Words
clock
before reaching a high of 45% at 20 O'Use synonyms
clock
. The Use synonyms
percentage
declined rapidly to 15% Use synonyms
at the end
of the day.
Linking Words
On the contrary
, Linking Words
radio
is being heard by less than 5% of Use synonyms
people
at 1 am and Use synonyms
this
pattern continued until 6 O'Linking Words
clock
, which was followed by a sudden increase to 25% at 7 O'Use synonyms
clock
. The Use synonyms
percentage
of users dropped slowly from Use synonyms
this
point and hit a low of 5% Linking Words
at the end
of the night.Linking Words