
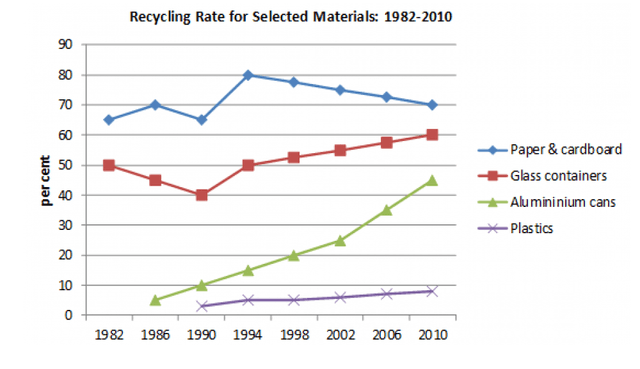
The graph illustrates the
percentage
of 4 materials, Glass Use synonyms
containers
, Use synonyms
Paper
and Use synonyms
cardboard
, Use synonyms
Aluminium
cars and Use synonyms
plastics
were recycled in a country over a period of 28 years between 1982 and 2010.
Use synonyms
Overall
, Glass Linking Words
containers
, Use synonyms
Aluminium
Use synonyms
containers
, Use synonyms
ever
Correct word choice
and ever
plastics
Use synonyms
percentage
of recycleUse synonyms
shows
an upward trend, Correct subject-verb agreement
show
while
Linking Words
paper
and Use synonyms
cardboard
show a downward trend Use synonyms
also
, Linking Words
this
figure Linking Words
was
fluctuation over the time period.
Unnecessary verb
apply
According to
the graph, the highest proportion of recycled material was Linking Words
paper
and Use synonyms
cardboard
Use synonyms
also
, other materials were under 70% in 1982. Followed byLinking Words
5
% rate was going up in 1986 but suddenly, the proportion dropped by 65% in 1990. Correct article usage
the 5
However
, Linking Words
Use synonyms
percentage
of Correct article usage
the percentage
paper
and Use synonyms
cardboard
dramatically raised to 80% in 1994, which was the highest rate of recycled systems. Glass Use synonyms
containers
recycled Use synonyms
percentage
was 50% in 1982 unfortunately Use synonyms
this
figure decreased to 40% in 1990, even Linking Words
through
again 10% rise to reach 50% in 1994 which was same as the beginning.
Correct your spelling
though
Aluminium
cans and Use synonyms
plastics
had a little bit similar pattern. The Use synonyms
aluminium
recycled system started in 1986 at 10% Use synonyms
also
Linking Words
plastics
recycled system started over 3 years at under 5% in 1990. Both Use synonyms
Aluminium
and Plastic were increased dramatically to reach Use synonyms
at
nearly 45% and nearly 9%, respectively, even though the Change preposition
apply
percentage
of Use synonyms
plastics
Use synonyms
couldn't
Correct pronoun usage
that couldn't
recycled
Change the verb form
be recycled
more
than 10% over the time period.Change preposition
by more