
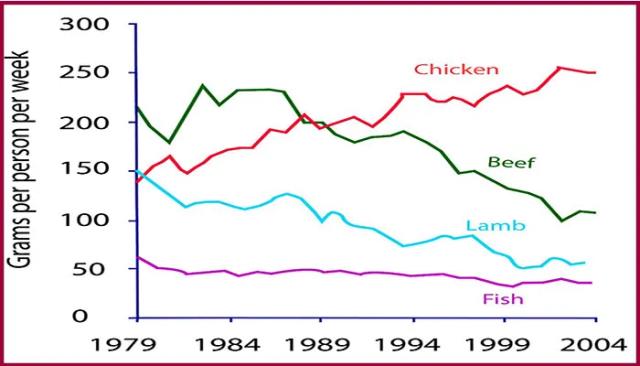
The line graph compares the amount of four types of food which people consumed in a European Country from 1979 to 2004.
We can see that beef and lamb were the highest consumed types of meat in 1979, which was eaten at around 220
grams
and exactly 150 Use synonyms
grams
per person per week respectively. The Use synonyms
consumption
of beef Use synonyms
then
reached its peak of 240 Linking Words
grams
in 1983 before tailing off to just around 100 Use synonyms
grams
in 2004. Showing a similar pattern, lamb Use synonyms
consumption
Use synonyms
also
saw a dramatic decline of almost 100 Linking Words
grams
to around 50 Use synonyms
grams
Use synonyms
at the end
of the period.
Linking Words
In contrast
, the chicken used was largely reversed. People gradually ate more and more of Linking Words
this
meat. Starting from only 150 Linking Words
grams
per week in 1979, the Use synonyms
consumption
rose to around 250 Use synonyms
grams
in 2004 which eventually became the most popular eaten meat in Use synonyms
this
country. Linking Words
However
, regarding fish Linking Words
consumption
, Use synonyms
although
it showed a slight decrease during the Linking Words
shown-period
, its Correct your spelling
shown period
consumption
remained the most stable among all.
In summary, the Use synonyms
consumption
of these four foods underwent huge changes over the period, except fish. And the Use synonyms
consumption
of fish Use synonyms
always
hung at the bottom of the graph.Add a missing verb
is always