
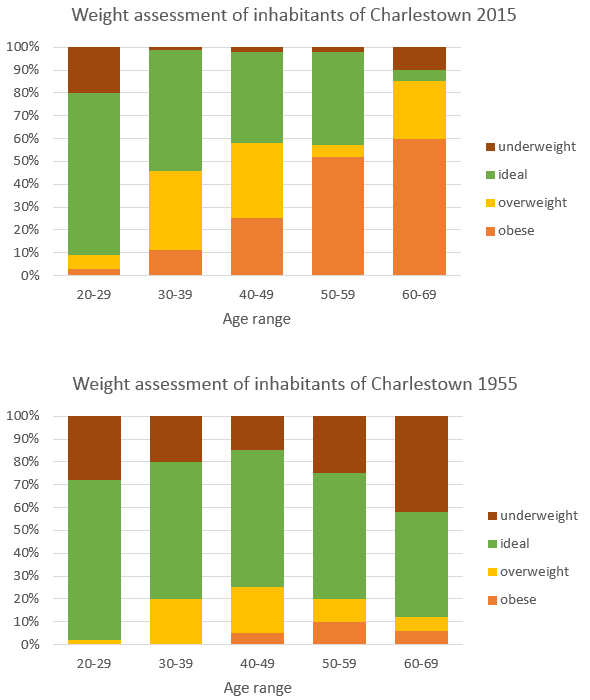
The chart illustrates the classification of reduced by 10
weight
measurements of Charlestown during the years 1995 to 2015. The data are classified into Use synonyms
age
groups of 20 to 29, 30 to 39, 50 to 59 and 60 to 69 and into Use synonyms
weight
Use synonyms
range
Fix the agreement mistake
ranges
such
as underweight, ideal, overweight and obese.
Linking Words
Overall
, In 1995, the Linking Words
population
was healthy with all Use synonyms
age
groups consisting of more than 50% of Use synonyms
people
with an ideal Use synonyms
weight
. In 2015 Use synonyms
however
, only Linking Words
people
within the Use synonyms
age
group of 20 to 29 had an ideal Use synonyms
weight
.
In 1995, more than 70% of the Use synonyms
population
aged 20 to 29 were ideal. Use synonyms
This
Linking Words
Add a missing verb
was
percent
and 60% of the Change the spelling
per cent
people
Use synonyms
of
the Change preposition
in
age
group 30 to 39 had an ideal Use synonyms
weight
, Use synonyms
whereas
the rest 40% was equally distributed between the overweight and underweight categories. The older Linking Words
population
consisted of the most underweight Use synonyms
people
compared to the rest of the Use synonyms
age
groups accounting for 40%.
In 2015, three-quarters of the young Use synonyms
people
are ideal, and about 60% of the older Use synonyms
population
are overweight. There is a gradual decreaseUse synonyms
of
Change preposition
in
people
with an ideal Use synonyms
weight
until the Use synonyms
age
of 60Use synonyms
were
about 60% are obese, more than 20% are overweight and only 5% are ideal.Correct your spelling
where