
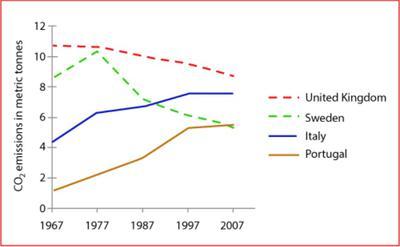
The line graph compares the average
emissions
of carbon dioxide per Use synonyms
person
in 4 European countries from 1967 to 2007.
Use synonyms
Overall
, Linking Words
it is clear that
the UK produced the most Linking Words
emissions
per capita of the 4 nations over the period Use synonyms
although
the levels fell slightly. The amount of CO2 emitted per Linking Words
person
dropped more markedly in Sweden Use synonyms
while
levels rose in Italy and Portugal.
In 1967, the UK and Sweden had the highest Linking Words
emissions
per Use synonyms
person
with around 11 metric Use synonyms
tonnes
and 9 Use synonyms
tonnes
respectively. Portuguese people had a much lower output, with under 2 Use synonyms
tonnes
and Italians about double Use synonyms
this
. Over the Linking Words
next
decade, carbon dioxide Linking Words
emissions
soared in Sweden to peak at just over 10 Use synonyms
tonnes
per Use synonyms
person
before falling suddenly. By the end of the period, Swedes had reduced their levels to under 6 Use synonyms
tonnes
Use synonyms
while
in the UK, the figure had fallen less sharply to around 9 Linking Words
tonnes
.
Use synonyms
In contrast
, there were significant increases in the CO2 emitted by Italians and Portuguese over the 40 years. Italy’s figure almost doubled, making it the Linking Words
second
highest emitter by 2007 Linking Words
while
Portugal’s figure rose even more dramatically to about 5 Linking Words
tonnes
per Use synonyms
person
in the final year.Use synonyms